Command Palette
Search for a command to run...
Based on 220 Marine Bacteria Species, Scientists Reconstructed the Heterotrophic Microbial Classification System Using a genome-scale Model, Identifying Eight Types of Metabolic flora.

Forests are hailed as the lungs of the Earth, while the ocean is its heart. The vast oceans are home to tens of thousands of microorganisms forming complex communities that regulate organic matter transformation and drive carbon fixation and release processes through their unique metabolic specializations, profoundly influencing global carbon cycles, climate change, and marine biodiversity. Among these, marine heterotrophic microorganisms act as "purification units" within the marine ecosystem, undertaking the core function of organic matter degradation, thereby maintaining global material cycles and ecological balance.
For a long time, marine heterotrophic microorganisms have been classically classified into two main categories: copiotrophic and oligotrophic. The former thrives in environments with high organic matter content, while the latter survives at a slow rate in resource-poor environments. This traditional "dichotomy," which has been used for many years, has helped biogeochemical research to some extent, but it also has significant shortcomings: the rate of growth cannot be equated with substrate utilization preferences and metabolic niches. Just as one cannot classify human dietary habits solely by the amount of food consumed, "what one likes to eat" is the key factor determining the rate of organic matter decomposition and regulating the direction of the carbon cycle.
To address this, a team led by the University of Southern California, relying on the Ocean Microbial Database (OMD), analyzed massive amounts of marine bacterial genomes using genome-scale metabolic models (GEMs). By quantifying the sensitivity of microorganisms to the utilization of 11 types of organic substrates, they ultimately broke through the traditional "dichotomy" framework.Eight categories of differentiated metabolic microbiota were identified: one category of fast-growing eutrophic microbiota, three categories of substrate-specific slow-growing oligotrophic microbiota, and four categories of substrate-specialized intermediate-growth microbiota.
The findings, titled "Defining metabolic niches for marine microbial heterotrophs," were published in Science Advances.
Research highlights:
* Breaking away from the classic "dichotomy" framework, it anchors microbial-specific metabolic niches based on actual metabolic strategies and substrate preferences.
* Based on eight functional microbial communities, this study systematically reveals the growth patterns, resource competition models, and global geographical distribution of marine heterotrophic microorganisms, elucidating the intrinsic mechanism by which microorganisms drive the marine carbon cycle.
* To fill the research gaps regarding the participation of marine heterotrophic microorganisms in the global carbon cycle, and to provide refined improvement ideas and parameter schemes for biogeochemical models.
Paper address:
https://www.science.org/doi/10.1126/sciadv.adz0537
Dataset: Covering 220 different categories of marine bacteria
This study is based on a large-scale marine microbial genome dataset, which is taken from the OMD database hosted on the microbiomics.io platform.The database contains approximately 35,000 microbial genomes.It includes metagenomically assembled genomes, single-cell amplified genomes, and genomes of artificially isolated and cultured strains.
This study only included bacterial genomes with integrity > 80% and contamination rate < 5%. The two sets of values were calculated using the average scores from CheckM and Anvi'o software, respectively. Subsequently, researchers used metadata from the OMD database and employed dRep software to remove redundancy from the genomes using an average nucleotide identity (ANI) threshold of 95%.
After removing 180 photosynthetic autotrophic cyanobacteria (exogroups),Ultimately, 3,738 high-quality heterotrophic bacterial genomes were obtained after redundancy removal.This constitutes the basic analytical dataset for this study. The dataset covers 220 different categories of marine bacteria, of which 14 groups contain ≥ 50 genomes.
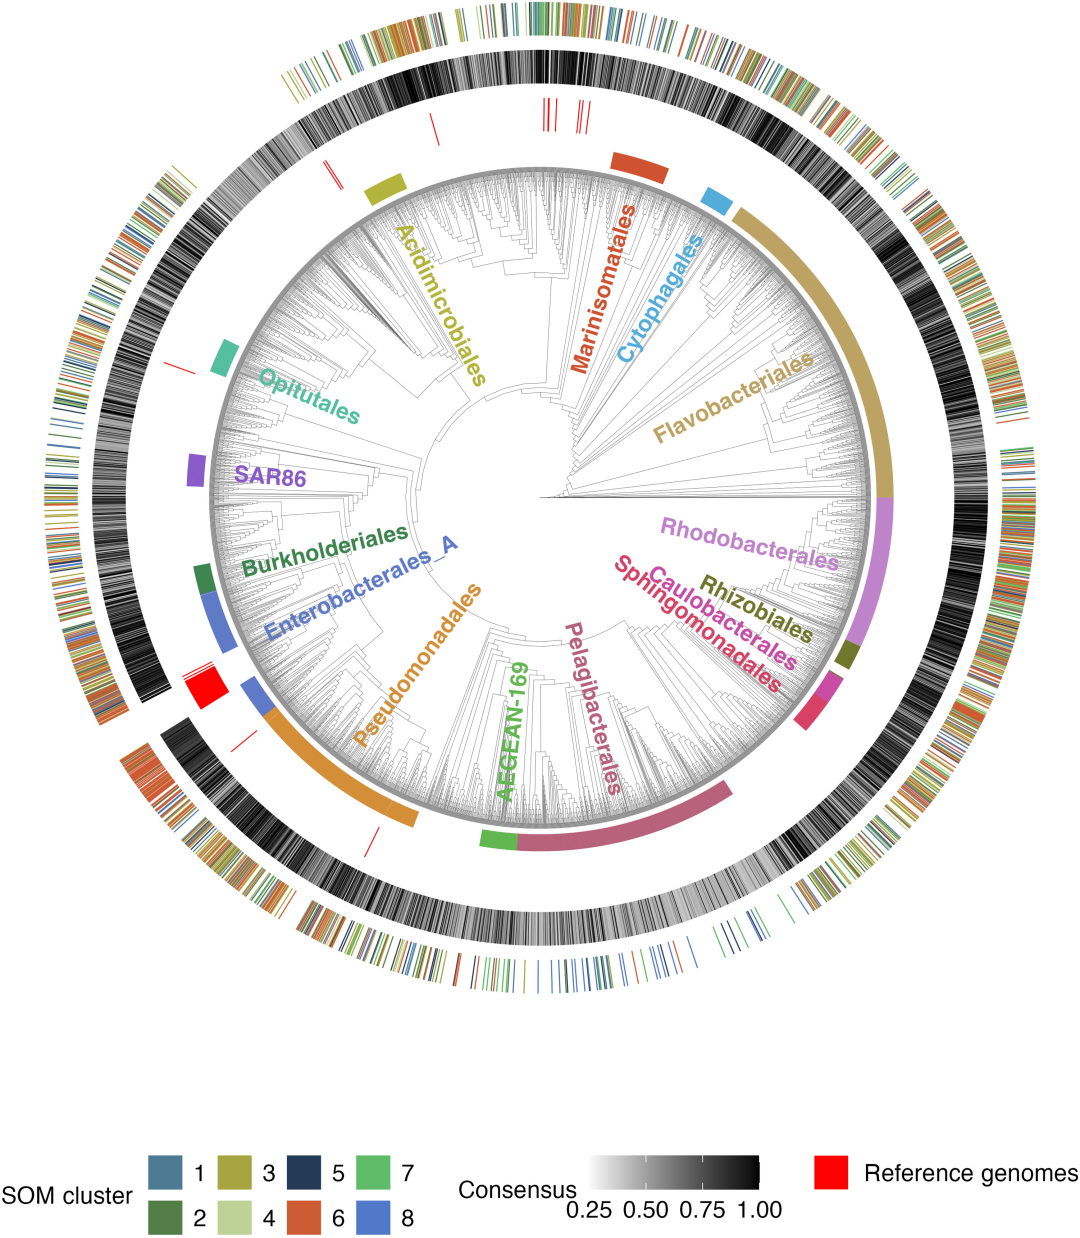
In constructing the phylogenetic tree, in addition to retaining 180 cyanobacterial genomes as outgroups, 66 bacterial reference genomes from the BiGG database were added, bringing the total number of genomes to 3,984. Eight genomes were removed from the phylogenetic tree due to insufficient matching of target single-copy genes.Ultimately, 3,976 plants were used to construct developmental trees.The entire genome classification information was labeled on the tree using the GTDB-Tk v2.1.0 and GTDB r214 databases.
Self-organizing map neural networks are used to classify metabolic niches.
In order to break through the limitations of the traditional "dichotomy" framework,This study integrates genomics, constrained metabolic simulation, and unsupervised machine learning techniques to build a complete analytical framework from genetic information to microbial ecotyping.Metabolic modeling, substrate sensitivity quantification, and microbial community clustering were completed hierarchically using multiple types of field measurements and global environmental datasets.
Modeling and Quality Control
In the model building phase, researchers employed an integrated modeling strategy.CarveMe v1.5.1 software was used to construct 60 independent metabolic models (model sets) for each of the 3738 marine heterotrophic bacteria strains.
Specifically, the CarveMe software's modeling principle relies on a general metabolic model architecture. Based on the presence or absence of each biochemical reaction in the input genome annotation information, it assigns weights to each reaction step, thereby initializing the general model and predicting the corresponding genome's metabolic model. This study comprehensively explored the number of model repetitions required to cover the reaction profile of a single genome. The results show that when the number of models in the ensemble reaches approximately 60, the total number of newly added reactions becomes relatively stable.This demonstrates that a set of 60 models can cover the vast majority of feasible metabolic model combinations for a single genome.
To quantify the quality of CarveMe's output metabolic model, the study pioneered a consistency score index C as an evaluation metric, as shown in the following formula:
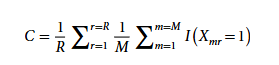
In the formula, Xmr represents the "presence-deletion matrix" of the ensemble model response in the M independently constructed models; r refers to a single biochemical response; R is the total number of responses in the entire model set; and I is an indicator function used to determine whether response r exists in the m-th ensemble sub-model. Subsequent analysis only retained genomic samples with a consistency score ≥ 0.8, totaling 1,578 genomes.
Metabolic strategy assessment
Researchers define metabolic strategies as the preferred set of substrates for an organism's growth, and their methodology involves interpreting these strategies through a series of sensitivity analyses.
Specifically,Researchers used the flux balance analysis (FBA) toolkit in the COBRApy v0.25.0 software package to conduct growth sensitivity tests on the CarveMe model under both "substrate-sufficient" and "substrate-limited" substrate supply conditions. The "substrate-restricted" condition is set by reducing the available flux of a certain class of compounds to 50% of the amount that the organism would take up under "substrate-sufficient" conditions.
To quantify the differences in substrate requirements among different models, a sensitivity coefficient index S is proposed, as shown below:
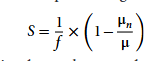
In the formula, μn represents the predicted growth rate under the condition of substrate limitation for type n, μ is the predicted growth rate under the condition of substrate abundance, and f is the substrate limitation coefficient (taken as 0.5 in this study). The sensitivity coefficient S ranges from [0,1], indicating that if the growth rate calculated by the model decreases by 50% after the substrate supply is reduced by 50%, then this type of substrate is determined to be a complete limiting factor for the organism's growth (growth sensitivity is 1); if the model growth rate does not change, it means that the growth of the organism is not affected by the supply of this type of substrate (growth sensitivity is 0).
In addition, when the ratio of the extent of substrate restriction to the extent of the decrease in growth rate is ≥ 0.8 (S ≥ 0.8), the model is considered to have significant growth sensitivity to such substrates.
Clustering analysis in unsupervised machine learning
The machine learning portion of the study employed self-organizing maps (SOMs) to delineate metabolic niches. SOMs is an unsupervised machine learning algorithm that can reduce the dimensionality of massive high-dimensional datasets to a two-dimensional grid space with topological structure.
Before clustering, the researchers added a round of data screening to the 1,578 genomes obtained above, and counted the growth sensitivity variances of various metabolites in all 60 sub-models. They removed 100 genomes with a total substrate sensitivity variance > 0.1, leaving 1,478 genomes. A total of 88,680 sets of valid data (1,478 genomes x 60 ensemble models) were used for SOMs clustering analysis. Each data point contained 11 metabolic sensitivity characteristic indicators.
In terms of specific settings, this study used Kohonen v3.0.12 software to process the standardized compound flux prediction data. 1,500 iterations were performed on a 20 x 20 toroidal hexagonal grid (using standard Euclidean distance to characterize spatial distance). The learning rate parameter was set to (0.025, 0.01), and the neighborhood radius was selected from the software's default value.
After sufficient training, based on the consistency of the growth compound sensitivity prediction results, the K-means clustering algorithm is adopted.The SOMs map was ultimately divided into 8 differential clusters.
After clustering, to assess the differences in maximum growth rate, the study calculated the dCUB of all 1478 genomes using gRodon to classify fast and slow growth types. Based on 1,209 metagenomics from several datasets including Tara Oceans, BioGeoTraces, and Malaspina, as well as a Global ASV Dataset by McNichol et al., the global geographical distribution of the eight bacterial communities was validated.
Eight metabolic clusters were classified based on substrate preference and growth rate.
The study presents diverse experimental results, which not only validate the model's performance but, more importantly, break through the traditional "dichotomy" framework, propose a completely new classification logic, and construct the intrinsic relationship between substrate preference and metabolic niche.
Model validation results
Researchers validated the accuracy of the CarveMe model's ability to capture substrate preferences in large-scale culture experiments on the carbon source preferences of 186 marine microorganisms. Specifically, they constructed a CarveMe model for the genomes studied by Gralka et al. and conducted corresponding in-silico experiments using FBA to test the growth of these microorganisms under the same carbon source conditions.
The results show thatCompared with the experimental data in the literature, the model prediction results achieved an accuracy of 75.51 TP3T and an accuracy of 87.41 TP3T.To assess whether this result was significantly better than random prediction, the researchers tested it by performing a bootstrap analysis on the random prediction, and the results showed that the model's accuracy was significantly higher than that of the random level.
Results of typing of 8 types of bacteria
Based on 1,478 genome sequences and 11 sensitive indicators,The study identified eight differentially expressed metabolic microbial communities through SOM clustering and categorized them into three main groups—fast, medium, and slow—based on their growth rates.Specifically (as shown in the image below):
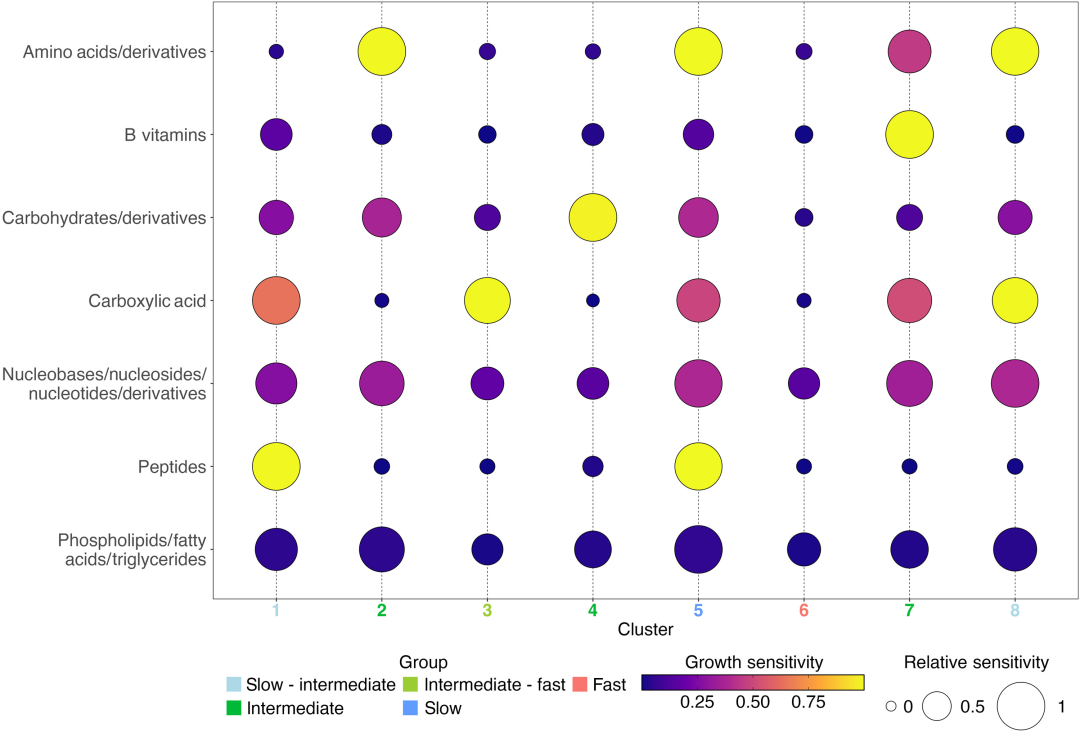
Comparison of average growth sensitivity of 8 SOM clusters
Category 1: Fast-growing eutrophic microbiota (Cluster 6): This is a typical eutrophic microbiota, where the 79.5% genome predicts a maximum genome growth rate higher than the slow growth threshold (dCUB < -0.08 is the rapid growth threshold; a smaller dCUB value indicates faster growth). From a taxonomic perspective, typical representatives of Cluster 6 include Enterobacterales, Flavobacteriales, Rhodobacterales, and Pseudomonadale. This type of microbiota is least affected by substrates; the absence of any one of the 11 tested compounds did not inhibit its growth.
Three substrate-specific, slow-growing, oligotrophic bacterial groups (cluster 1, cluster 5, and cluster 8): dCUB = -0.111 for these groups. Among them, cluster 5 (61.81 TP3T) has the lowest maximum growth rate, with typical representatives being Opitutales (Verrucomicrobiota) and Pelagibacterales, whose enrichment in this group reaches 4351 TP3T and 3621 TP3T, respectively.
Four substrate-specific intermediate-growth bacterial groups (clusters 2, 3, 4, and 7): These groups were predicted to have significantly lower growth rates than cluster 6, but significantly higher than cluster 5. Cluster 3 showed a significantly better growth rate than clusters 1 and 8. Each of these four intermediate-growth bacterial groups exhibited growth response sensitivity to only one type of compound: amino acids, carboxylic acids, carbohydrates, and B vitamins.
Furthermore, the characteristics of intermediate-growth microbial communities also validate a recent study suggesting that the dominant heterotrophic microbial groups in the marine subsurface environment may be slow-growing eutrophic bacteria. This finding can provide a basis for classifying these microorganisms into metabolic functional groups, such as cluster 4's preference for carbohydrates.
Final Thoughts
In summary, this study breaks away from the decades-old "dichotomy" framework of eutrophic/oligotrophic niches and establishes an eight-category metabolic niche classification system based on the essence of gene and substrate utilization, thus breaking the inherent binding between the five categories and physiological functions.
Furthermore, this new classification framework simplifies the complex structure of the vast number of heterotrophic microorganisms in the ocean. In the future, it can be embedded into global biogeochemical models, eliminating the need to individually record tens of thousands of marine bacteria. It can deduce the degradation of marine organic matter and changes in carbon balance based on only 8 functional parameters, providing a brand-new theoretical tool for assessing the evolution of ocean carbon cycle under the background of global warming.