Command Palette
Search for a command to run...
What Will the World Look Like in 2100? Predicting Future Cities With Remote Sensing Data
Have you ever imagined what the world will look like in 2100? How will our cities develop? Recently, two data scientists used data science and machine learning to predict the global urban expansion trend in 2100.
Some time ago, a video that used AI to restore the street scenes of Beijing in the Republic of China went viral on the Internet, allowing the entire nation to travel back 100 years to experience life in the capital at that time.
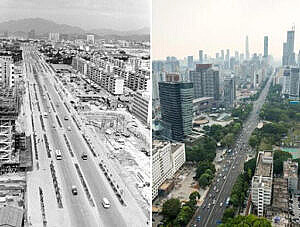
Looking at the brick houses, horse-drawn carriages, and vendors setting up stalls at the market, everyone was impressed by how much changes have taken place in 100 years.
Indeed, in a century, many cities have undergone tremendous changes. Buildings are getting taller, transportation is getting more convenient, and urban areas are getting larger...

Researchers used satellite imagery to map urban growth between 1985 and 2015.In the past 30 years, the global urban area has expanded by 80%, and the urban population growth rate is much higher than the global population growth rate.
And what will cities around the world look like in 100 years, or even longer?
Now, using data science and simulation models, it is possible to predict the development pattern of a city based on historical data and national conditions and society.
Learn from history to predict the future
Recently, Jing Gao, a data scientist at the University of Delaware, and Brian O'Neill, an alumnus and professor at the University of Denver,A global simulation model was released that uses data science and machine learning to see how cities will change.

Jing Gao said she is particularly fascinated by the way towns develop. Looking around the world, from New Delhi, India to Paris, France, cities around the world develop in different ways.
Take Chicago, Los Angeles, and New York, for example. These cities have grown in different ways in terms of the expansion of their land area.
Therefore, in order to explain the uncertainty of urbanization in the long term, Jing Gao and O'Neill Five scenarios consistent with Shared Socioeconomic Pathways (SSPs) were developed using a modelling framework combined with Monte Carlo methods.
The model uses data science and machine learning techniques to conduct long-term observations of urbanization trends every decade, and can predict how urban land will change in the next 100 years under different social and economic conditions.
To understand how this change is happening, Jing Gao and O'Neill used data science to analyze 15 global satellite remote sensing datasets to understand urban land changes over the past 40 years.
These remote sensing datasets have an accuracy of about 125 feet (38 meters), which is enough to give a rough idea of what each area of the city looks like.
Jing Gao says:“Mining historical data revealed three different styles of urbanization: urbanization, stable urbanization, and rapid urbanization.”Over time, countries will progress from rapid urbanization to stable urbanization and then to urbanization.
As we all know, the United States and most Western European countries have achieved urbanization, India and China experienced rapid development before and have now transitioned to stable urbanization. Currently, many African countries are still in the stage of rapid urbanization.
The total urban area will exceed 225 million football fields
However, understanding broad regional developments through remote sensing data alone is not enough to understand how urbanization is taking place locally from a global perspective.
To do this, the researchers divided the world into 375 small regions and ran a custom development model for each simultaneously, then pieced all the model results together to create a global map.

For example, the continental United States is modeled as 28 separate regions, and China is modeled as 26 regions. Models for different regions use different development model parameters for estimation.
The research team's predictions show thatBy 2100, the total urban area on Earth will increase by 1.8 to 5.9 times.

According to projections, approximately 618,000 square miles (1.6 million square kilometers) of new urban areas will be built worldwide this century.That's an area roughly 4.5 times the size of Germany, or more than 225 million football fields.
This is a summary and evaluation based on the patterns of urban development over the past few decades, assuming that no large-scale transformative events such as war, disease, revolution, etc. occur.
In addition, if we are fortunate enough to witness major events such as extraterrestrial civilizations during this hundred years, it will also affect the model results.
The stronger the environmental awareness, the slower the urban expansion
But how cities expand will depend largely on societal trends over the coming years. These include trends in economic growth, demographic change and lifestyle habits, as well as our attitudes towards the environment.

Light blue: sustainable development; dark blue: middle of the road;Yellow: Regional competition; Orange: Inequality; Red: Fossil fuel development
In the United States,If people focus on sustainable development, such as green development and environmental awareness, then urban expansion is least likely.
In this scenario, urban land is expected to increase 1.3 times by 2100.
However, if people tend to develop highly materialistic development and consume a lot of fossil fuels in the same time frame, for example, the urban expansion rate in Asian countries is predicted to be very high, even four times higher than the urban expansion rate in the United States at the beginning of this century.

Darker colors indicate a higher degree of urbanization
Most people don't realize that changes to the landscape, such as buildings and roads, can affect their lives.
In Delaware, for example, homes built near the coast often come at the expense of farmland.
While these developments may help regional economies prosper, they may also have other unintended consequences, such as increasing the likelihood of coastal flooding and sea level rise.
If these extremely low-probability events really happen, not only will the cities not continue to develop, but some cities may inevitably become history.
Moreover, no matter which socioeconomic model is chosen, simulation results show thatBy the end of this century, most countries in the world will be urbanized.
So the question is, which city do you think you will be in 80 years from now? And where in the city will you be?
Paper address:
https://www.nature.com/articles/s41467-020-15788-7.pdf
-- over--