Command Palette
Search for a command to run...
MIT/IBM Has Released ChartNet, the Largest Synthetic Chart Dataset to Date, Generating 1.5 Million Diverse Chart samples.

Over the past two years, the development of multimodal large models has far exceeded expectations. From recognizing image content to understanding complex documents and parsing video information, visual language models (VLMs) are constantly pushing the boundaries of their capabilities. However, there is one seemingly simple yet extremely challenging visual object that still causes many advanced models to frequently "crash" – charts.
For humans, a bar chart, line chart, or scatter plot can quickly convey trends, comparisons, and key conclusions. However, for AI, charts are far more than just images. Models need to not only recognize visual elements but also understand the relationships between axes, data points, legends, and labels, and further perform numerical extraction, trend analysis, and even causal inference. In other words, chart understanding is essentially a complex task that spans visual, numerical, and linguistic cognitive abilities, and current VLMs can only partially achieve this.
In recent years, some datasets have driven the development of related research, but they generally suffer from three problems: small scale, limited graph types, and lack of complete multimodal information. Many datasets focus only on a single task (such as question answering or graph description) or lack key modalities, so open-source models still lag behind proprietary systems in complex graph reasoning tasks.
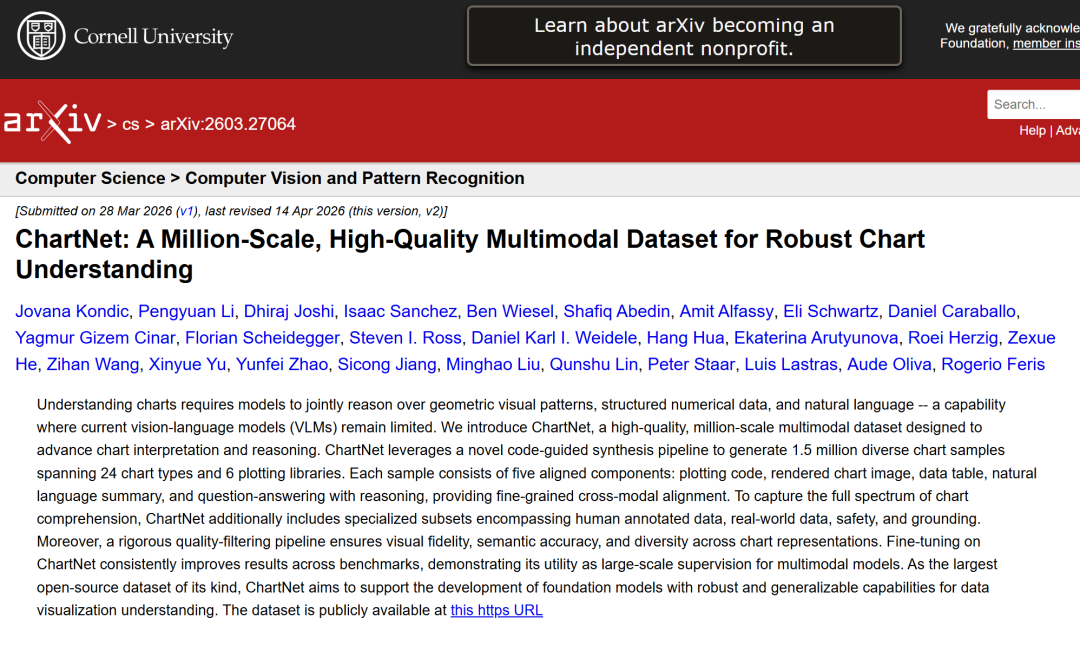
To fill this gap,ChartNet was proposed by numerous experts from MIT, the MIT-IBM Computing Research Laboratory, and IBM Research.—A high-quality, multimodal dataset of millions of records for graph understanding, designed to advance graph understanding and reasoning capabilities.
This is the largest synthetic chart dataset to date, employing a novel code-guided synthesis process to generate 1.5 million diverse chart samples covering 24 chart types and 6 plotting libraries. Extensive experiments validate the practicality of ChartNet, showing that its optimal fine-tuned model outperforms much larger models and GPT-4o on all tasks.
Use the dataset online:https://go.hyper.ai/lGPsc
The related research findings, titled "ChartNet: A Million-Scale, High-Quality Multimodal Dataset for Robust Chart Understanding," will be published at the IEEE Conference on Computer Vision and Pattern Recognition.
Research highlights:
ChartNet's code-guided synthesis and generation process enables the generation of chart samples on a large scale, while capturing visual, structural, numerical, and textual information about chart understanding.
ChartNet integrates real-world data and manually labeled data, and includes a specialized subset that supports visual pointing and security analysis, expanding the value of datasets in model training and evaluation.
Fine-tuning on this dataset can continuously improve the performance of the visual-language model in tasks such as chart reconstruction, data extraction, and chart summarization.
Paper address:
https://hyper.ai/papers/2603.27064
Dataset: Composed of 1.5 million multimodal aligned synthetic samples
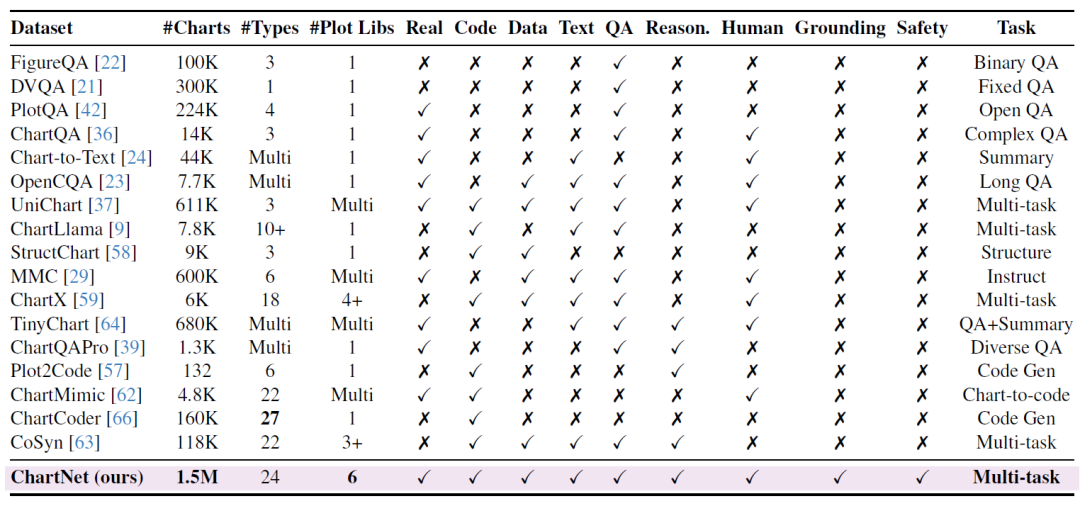
The ChartNet core dataset consists of 1.5 million multimodal aligned synthetic samples.Each sample includes: a chart image, plotting code, tabular data, natural language description, and a question-answer pair with chained reasoning (CoT). A complete overview of the data attributes, chart types, and plotting libraries used is shown in the following figure:
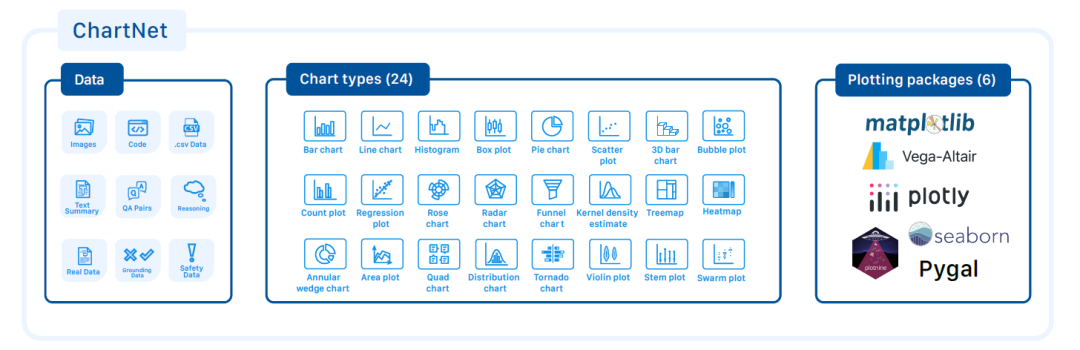
To cover the full spectrum of capabilities for graph understanding, ChartNet also includes several specialized subsets: manually labeled data, real-world graphs, grounding data, and security data.
Manually labeled composite chart data:It contains 96,643 aligned synthetic chart images, descriptions, and tabular data, all of which have undergone rigorous human validation and annotation.
High-quality real-world chart data:To supplement the synthetic chart corpus, researchers compiled and annotated 30,000 real-world charts from authoritative international media and data visualization organizations, such as the World Bank, Bain & Company, Pew Research Center, Our World in Data, and other globally renowned publishers. This collection covers a wide range of contemporary topics, including economics, technology, geopolitics, environmental science, and social trends, while ensuring high data diversity and strong real-world relevance. Charts with low information content or substandard quality were explicitly removed to ensure interpretability.
Grounding QA on data:Modern Visual Modeling (VLM) still struggles to identify chart regions and syntactic elements relevant to specific questions. To improve this ability, researchers constructed a grounding QA pair. First, they extracted geometrically aware annotations from plotting code elements (axes, ticks, grid lines, legends, and graphic blocks) to generate dense chart grounding annotations. An entropy-based method was used to further filter bounding boxes. Then, using the generated grounding annotations, a set of templated questions and answers was created for each chart to capture the correspondence between the expected spatial layout of visual elements and the actual content within the chart.
The expected location is encoded into the answer string using a serialized bounding box representation. Templates encompass unique and recurring visual elements, combining indices, in-chart text labels, and visual attributes such as element color to generate citation expressions. The generator supports both short and long answers and can optionally include grounding information. The final dataset generates one QA pair per chart by uniformly sampling across all template types and output modalities. Additionally, inference-based grounding QA pairs are generated using gpt-oss-120b.
Security data:To address security concerns, researchers expanded the data generation process to produce chart-related security-aligned data, reducing harmful content in the model output and the risk of "jailbreaking".
ChartNet's core idea: Code-guided synthesis of charts for automatic generation.
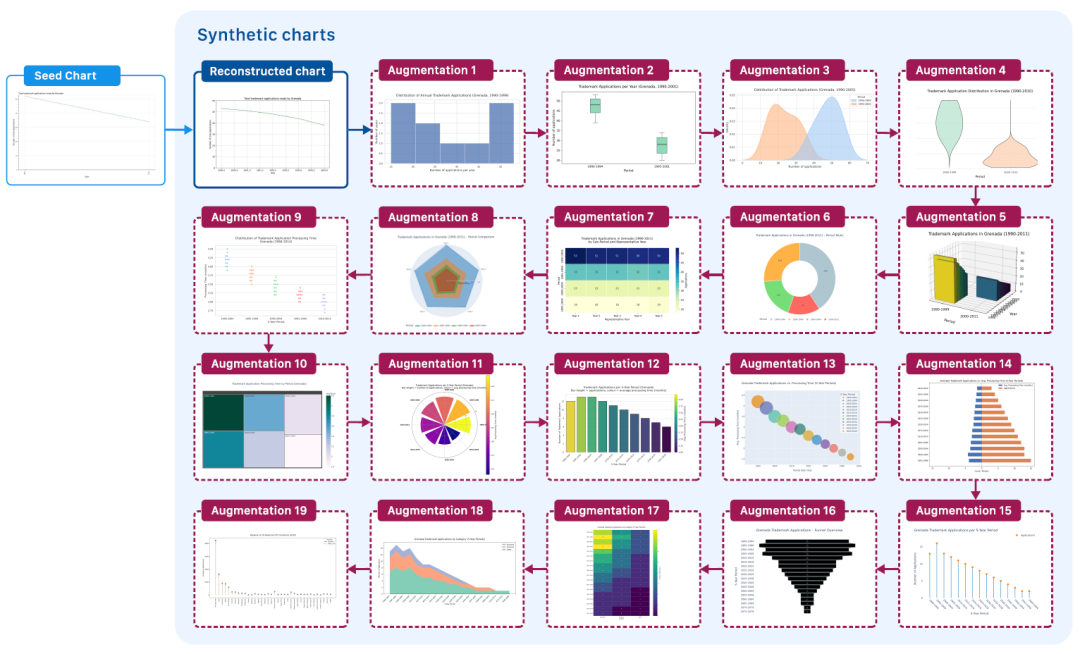
The core idea behind ChartNet data generation is that charts can be generated programmatically, with executable plotting code serving as a structured intermediate representation for data visualization. Researchers have proposed a large-scale code-guided automated chart generation process (see figure below), which starts with a limited amount of chart image data ("seeds") and uses a visual-language model (VLM) to output code that can roughly reconstruct these charts.
Code-Guided Chart Augmentation Process
Specifically, the data generation process includes the following stages:
① Chart-to-Code Reconstruction:VLM is used to generate Python plotting code to roughly reconstruct a given set of chart images. At this stage, 150,000 unique chart images from the TinyChart dataset are selected as seeds, but the process has no specific dependency on seed selection.
② Code-Guided Chart Augmentation:Using the generated plotting code as input, the code is iteratively rewritten using a Large Language Model (LLM). While maintaining relevance to the previous iteration, the underlying data values and labels are modified to better match the desired chart type. The figure below illustrates the iterative code enhancement and chart rendering process; this stage is a key step in scaling the dataset, where each seed image can generate any number of variants.
③ Chart Rendering:Execute all generated plotting code to produce chart images, and successfully executed scripts will be paired with their generated images.
④ Quality Filtering:Each chart image is evaluated using VLM to detect various potential rendering defect categories (such as text overlap, label clipping, chart element occlusion, etc.), and images with visual problems and their plotting code will be removed.
⑤ Code-Guided Attribute Generation:Finally, VLM is used to generate supplementary semantic attributes for the chart image-code pairs. Data values and labels are extracted from the chart within the context of the code, and a tabular data representation is generated. Furthermore, by combining visual information, code, and tabular data, a chart description with grounding is generated.
It delivers significant and consistent improvements across all graph comprehension tasks.
To verify the effectiveness of ChartNet in improving the model's ability to understand charts, researchers trained visual language models of different sizes on the ChartNet dataset, including ultra-compact (≤1B parameters), small (≤4B parameters), and medium (≤7B parameters).
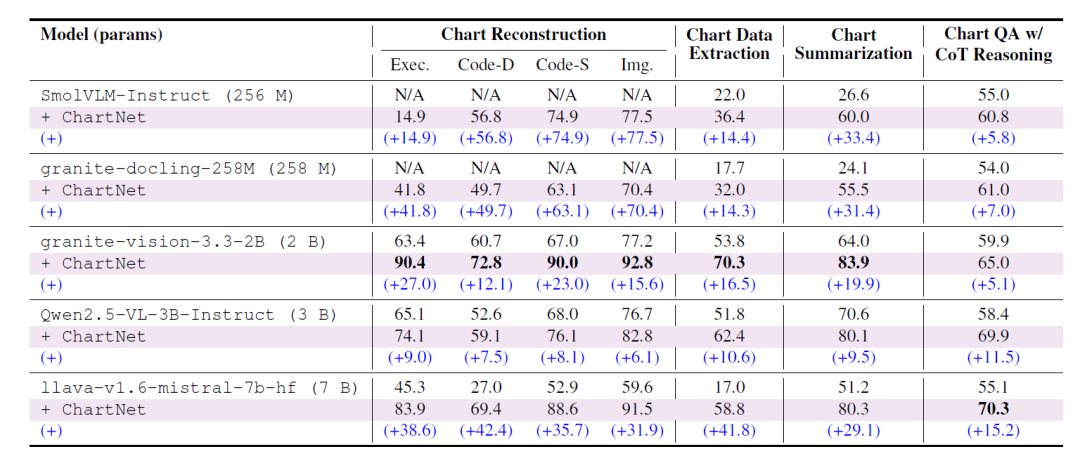
Overall, fine-tuning on the ChartNet dataset yields significant and consistent improvements across all chart understanding tasks (see table below) – the uniformity and magnitude of these improvements are independent of model size.This demonstrates that existing VLMs lack opportunities for high-quality multimodal graph-supervised training, while ChartNet effectively fills this gap.
① Chart Reconstruction
Models trained on the Chart-to-Code subset achieved significant improvements in code execution rate, data consistency, structural/code similarity, and image similarity: Ultra-compact models (SmolVLM-256M, Granite-Docling-258M) that were previously unable to reconstruct charts at all now possess full functionality; smaller models (such as Granite-Vision-2B) achieved near-perfect reconstruction, with multiple metrics exceeding 90%; the LLaVA-7B model achieved an improvement of up to +42.4 points in data consistency. This scale-independent trend indicates that ChartNet's multimodal alignment between images and code provides the model with structured supervision that was previously lacking in the dataset.
② Chart Data Extraction
ChartNet significantly improves the ability of all models to directly recover numerical tables from charts, with Granite-Vision-2B achieving the best performance at 70.31 TP3T. The finely tuned LLaVA-7B shows a performance improvement of +41.8 points, surpassing all open-source baselines and even exceeding GPT-4o (only 46.71 TP3T). This demonstrates the value of ChartNet's tight coupling between code-generated charts and CSV data, allowing the model to access both visual geometry and the underlying numerical structure.
③ Chart Summarization
The summarization quality of all model families improved significantly, with increases ranging from +9.5 (Qwen2.5-VL-3B) to +31.4 (Granite-Docling-2B). The fine-tuned Granite-Vision-2B reached 83.9%, surpassing GPT-4o and all open-source baselines in Table 3, including models with a parameter size an order of magnitude larger. This demonstrates that ChartNet's synthetic summarization (constructed jointly by code and rendered charts) provides structured and semantically complete supervisory signals for descriptive chart understanding.
④ Question and Answer Questions with CoT Reasoning
In complex, multi-stage inference tasks, each model showed a steady improvement in accuracy—LLaVA-7B showed the largest improvement (+15.17), reaching 70.3%, surpassing the dedicated chart inference model ChartGemma and all comparable or larger open-source models (including GPT-4o).
⑤ Comparison with Off-the-Shelf Models
The table below shows that the model fine-tuned by ChartNet outperforms the off-the-shelf model with larger parameters in almost all metrics. After fine-tuning, the 2B or 7B parameter models consistently outperform models with a scale of 20B–72B. In particular, in chart reconstruction and data extraction tasks, the ChartNet-fine-tuned model far surpasses GPT-4o.
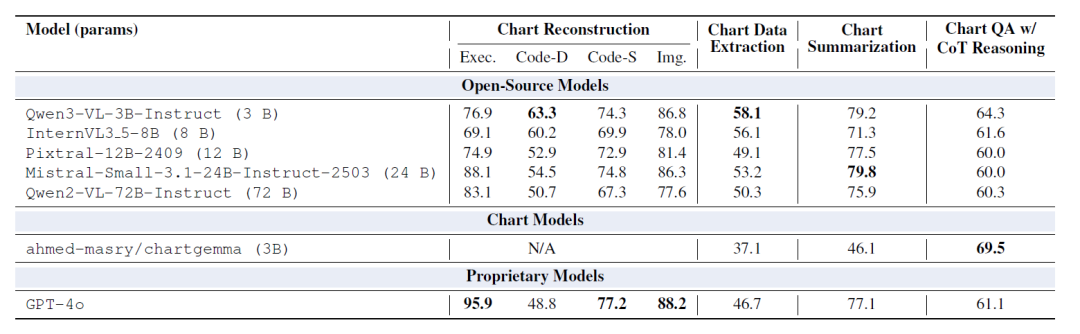
This suggests that for domains where vision, numerical data, and language are tightly coupled, such as graph understanding, providing high-quality, code-aligned multimodal supervision is more effective than simply increasing the model size.
⑥ Generalization to Public Benchmarks
As shown in the table below, after fine-tuning on the core ChartNet dataset, all models achieved significant improvements on public benchmarks: Granite-Vision-2B improved from 1.6 to 12.4 BLEU on ChartCap and from 30.8 to 58.4 on ChartMimic-v2; even the ultra-compact model (SmolVLM-256M) achieved a considerable performance boost. This improvement was consistent across both chart summarization and chart-to-code generation tasks, demonstrating that ChartNet's multimodal alignment supervision can be effectively transferred to real-world benchmarks, not just synthetic training distributions.
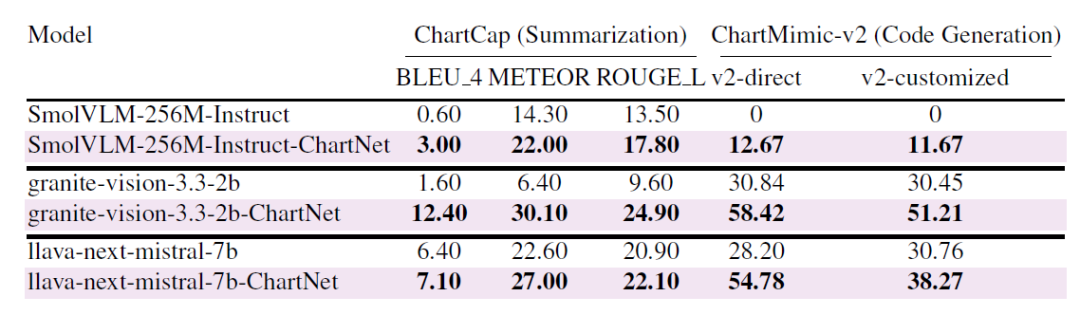
Gain generalization ability of ChartNet synthetic data on two real-world public benchmarks
Conclusion
ChartNet aims to address a core bottleneck in the field of chart understanding: the lack of large-scale, high-fidelity supervisory signals for aligning images, plotted code, numerical data, text descriptions, and inference trajectories. It provides a scalable and open foundational platform for multimodal modeling research in numerical reasoning, visualization understanding, document intelligence, and code alignment, propelling Visual Modeling (VLM) from "describing charts" to "understanding the structured information encoded in charts."
"Many previous training datasets only focused on answering simple questions about charts," said Jovana Kondic, a graduate student in the Department of Electrical Engineering and Computer Science (EECS) at MIT and the first author of the ChartNet-related paper. "We tried to go beyond that with ChartNet, generating data that can support a comprehensive and in-depth understanding of charts."
In the future, researchers plan to continue expanding ChartNet by incorporating more complex data, thereby creating real-world value for more industries.
References:
https://arxiv.org/abs/2603.27064
https://news.mit.edu/2026/mit-researchers-teach-ai-models-to-interpret-charts-0603