Command Palette
Search for a command to run...
데이터 주석의 효율적이고 통계적인 품질 추정에 관하여
데이터 주석의 효율적이고 통계적인 품질 추정에 관하여
Jan-Christoph Klie Juan Haladjian Marc Kirchner Rahul Nair
초록
주석 달아진 데이터셋은 지도 학습 모델을 학습, 평가, 비교 및 운영화하는 데 필수적인 구성 요소이다. 따라서 주석의 품질이 높아야 한다. 고품질 주석의 생성을 위해서는 양질의 품질 관리와 이를 위한 신뢰할 수 있는 품질 추정이 필요하다. 주석 과정에서 품질이 충분하지 않을 경우, 품질을 개선하기 위한 시정 조치를 취할 수 있다. 품질 추정은 일반적으로 전문가가 개별 사례를 정확 또는 부정확으로 수동 라벨링하는 방식으로 수행된다. 그러나 모든 주석 사례를 검수하는 것은 비용이 많이 든다. 따라서 실무에서는 보통 부분집합만 검수하며, 그 크기는 대부분 통계적 검정력이나 다른 근거 없이 선택되고, 상대적으로 작은 경우가 많다. 그러나 작은 표본 크기에 기반한 추정은 오류율에 부정확한 값을 초래할 수 있다. 불필요하게 큰 표본 크기를 사용하는 것은 더 많은 주석에 사용할 수 있는 비용을 낭비하는 것이다. 따라서 본 연구에서는 먼저 주석 오류율을 추정하는 데 필요한 최소 표본 크기를 결정하기 위해 신뢰 구간을 활용하는 방법을 상세히 기술한다. 그 다음, 오류율 추정의 대안으로서 수락 표본 추출(acceptance sampling)을 적용할 것을 제안한다. 수락 표본 추출이 동일한 통계적 보장을 제공하면서 필요한 표본 크기를 최대 50%까지 줄일 수 있음을 보인다.
One-sentence Summary
UKP Lab at TU Darmstadt and Apple describe how to use confidence intervals to determine the minimal sample size for estimating annotation error rates and propose acceptance sampling as an alternative that reduces required sample sizes by up to 50% while maintaining equivalent statistical guarantees.
Key Contributions
-
Confidence intervals are used to determine the minimum sample size required to estimate annotation error rates under desired confidence and precision, replacing ad hoc sample size choices.
-
Acceptance sampling from manufacturing is adapted to annotation projects, allowing inspectors to decide whether to accept or reject batches rather than always directly estimating the full error rate.
-
Analysis of average sample sizes under two confidence and power configurations shows that acceptance sampling, especially sequential sampling with curtailment, can reduce required inspections by up to 50% while preserving statistical guarantees.
Introduction
The authors leverage confidence intervals and acceptance sampling to make data annotation quality estimation more statistically sound. Large annotated datasets are essential for training and validating machine learning models, but checking annotation quality manually is costly, and prior work often relies on agreement metrics or small ad hoc samples that can produce unreliable or overly optimistic error estimates. This paper contributes a statistical framework for estimating annotation error rates, shows that tight confidence bounds can require surprisingly large samples, and proposes acceptance sampling from manufacturing as an accept or reject method that provides similar guarantees while needing up to 50 percent fewer inspected examples. The authors also provide a Python package to apply these methods in annotation workflows.
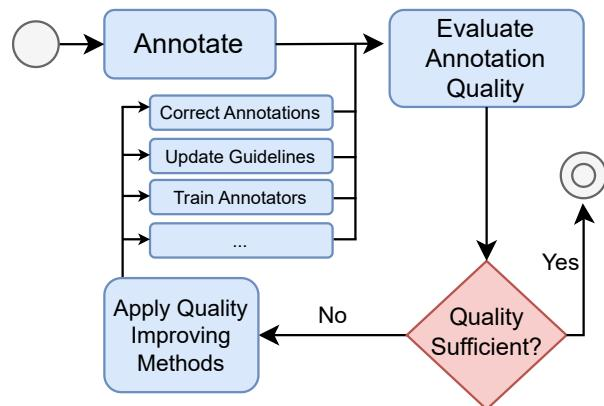
Dataset

- The authors evaluate acceptance sampling on two real datasets known to contain non-negligible annotation errors: CoNLL 2003 and IMDB.
- CoNLL 2003 is a named entity recognition dataset introduced by Tjong Kim Sang and De Meulder (2003), with annotation errors analyzed by Reiss et al. (2020).
- IMDB is a sentence-level sentiment classification dataset introduced by Maas et al. (2011), with annotation errors analyzed by Northcutt et al. (2021).
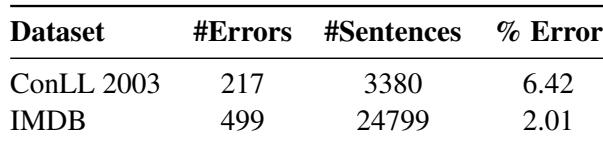
- The dataset sizes and error counts used in the experiments are taken from Klie et al. (2023) and reported in Table 2.
- For CoNLL 2003, annotations and errors are treated at the sentence level to satisfy the independence assumption required by the statistical acceptance sampling analysis.
- The datasets are used to observe the practical behavior of acceptance sampling under real annotation error rates.
Method
The authors leverage batch sampling, statistical inference, and acceptance decision rules to estimate annotation quality with limited manual inspection. The workflow begins with annotation batches, from which a subset of instances is manually reviewed. For a batch of size N, inspecting n instances without replacement produces an error count X. If K denotes the latent number of incorrect annotations in the batch, the inspected error count follows the hypergeometric distribution:
P(X=x)=(nN)(xK)(n−xN−K).This distribution is preferred over a binomial approximation because manual inspection does not resample the same instance. The binomial shortcut becomes unsafe when n/N is not very small, which is common in tight statistical quality control settings. The sampling unit also needs to respect annotation dependencies. For example, span labeling tasks should ideally be sampled at the sentence level, while text recognition or object classification tasks should be sampled at the image level rather than at the bounding box level.
A first quality estimation module computes the observed error rate as the ratio of incorrect inspected annotations to the total number of inspected annotations. The authors caution that reporting only this point estimate is weak because it does not reveal precision or uncertainty. Instead, they model the error rate as an unknown proportion θ and construct confidence intervals for it. The exact interval construction is based on the discrete cumulative distribution function and is defined by
P(X≥k;θl)=2α1, P(X≤k;θu)=2α2, α1+α2≤α,where k is the observed number of errors and θl,θu bound the estimated error rate. For simplicity, the two tails are usually treated symmetrically. The corresponding sample size for a desired confidence level and interval half width can then be found by numerically solving
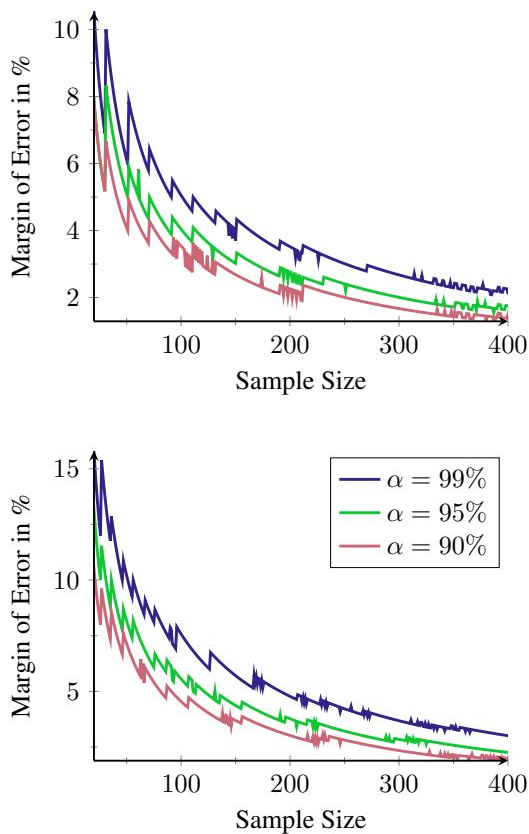
P(X≥k;θl)+P(X≤k;θu)−α=0.Because the hypergeometric distribution is discrete, exact intervals are often conservative. That is, they may be slightly wider than the nominal confidence level requires, which tends to suggest somewhat larger sample sizes than strictly necessary. The authors favor this conservative behavior because approximations can otherwise produce unstable sample sizes or poor coverage near extreme proportions, including very low error rates. The relationship between sample size, confidence, and margin of error is central to this module. Refer to the figure below:
The second module reframes quality control as a decision problem rather than an estimation problem. Acceptance sampling does not directly estimate the batch error rate. Instead, it decides whether a batch is acceptable or should be rejected based on the number of errors found in a sample. A sampling plan specifies the sample size, the acceptance limit, and the rejection boundary by solving
P(X≤c;pa,n)≥1−α, P(X≤c;pr,n)≤β,with 0<pa<pr<1 and 1>1−α>β>0. Here, pa is the desirable error rate, pr is the unacceptable error rate, α is the producer risk associated with rejecting a good batch, and β is the consumer risk associated with accepting a bad batch. The interval between pa and pr is the indifference zone, where the plan may still accept or reject depending on the sampled result. The three common plan families are single sampling, double sampling, and sequential sampling. Their decision flows are shown below:
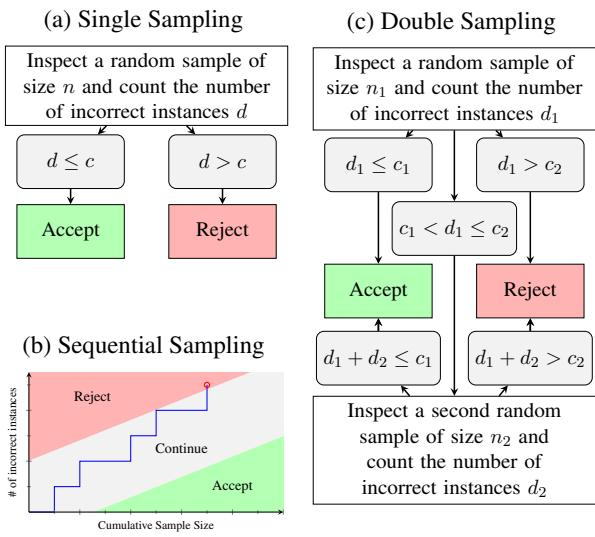
Single sampling inspects one sample of size n and accepts the batch if the observed error count is at most c. Its average sample number is constant because the full sample is always inspected. Double sampling begins with a first sample of size n1. If the first error count is low enough, the batch is accepted immediately. If it is high enough, the batch is rejected immediately. If the first result falls in the middle region, a second sample of size n2 is inspected, and the combined error count determines the final decision. Curtailment further reduces inspection effort by stopping the second sample early once rejection becomes unavoidable. The expected inspection effort can be expressed for the full plan as
ASNf=n1PI+(n1+n2)(1−PI),where
PI=P(D1≤c1)+P(D1>c2),and D1 is the error count in the first sample. Curtailed plans use a more intricate expression because inspection may stop before the second sample is fully processed.
Sequential sampling generalizes double sampling by inspecting instances one by one. After each inspection, the method compares the accumulated error count against acceptance and rejection boundaries. If the count is too high, the batch is rejected. If it is low enough, the batch is accepted. Otherwise, inspection continues. The boundaries depend on pa, pr, α, β, the number of inspected instances, and the number of errors observed so far. To avoid excessively long inspection paths, the method can be truncated at the sample size of a corresponding single sampling plan. In that case, the final decision follows the single sampling acceptance limit. Curtailment adjusts the boundaries to shrink the continuation region and stop earlier, though exact optimal curtailment for the hypergeometric setting is more difficult than in the binomial case.
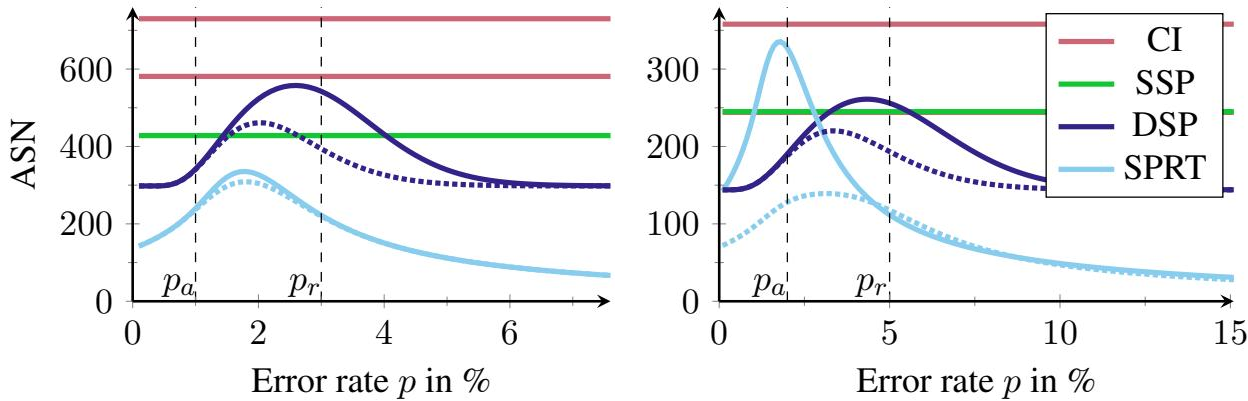
The analysis stage compares the practical inspection cost of these modules using the average sample number, or ASN. For confidence intervals and single sampling, the ASN is fixed because there is no early stopping. For double and sequential sampling, the ASN depends on the true error rate of the batch. The authors evaluate strict and relaxed quality control settings over a batch size of N=1000. Confidence interval based rate estimation requires the largest samples because it estimates a small error proportion with tight bounds. Single sampling is usually more economical than double sampling without curtailment, while curtailed double sampling improves efficiency. Curtailed sequential sampling gives the lowest required inspection effort under the evaluated configurations. The analytical average sample number comparison for confidence intervals, single sampling, double sampling, and sequential sampling is shown in the figure below, where dotted curves denote curtailment:
Experiment
The experiments evaluate how sample size affects the reliability of annotation error estimates and examine acceptance sampling on real datasets with known errors. Simulation results show that small samples, especially below roughly 300, produce wide confidence intervals and imprecise estimates, while larger samples improve precision. The application to CoNLL 2003 and IMDB demonstrates practical acceptance sampling, including sentence level analysis for CoNLL 2003 to support statistical independence.
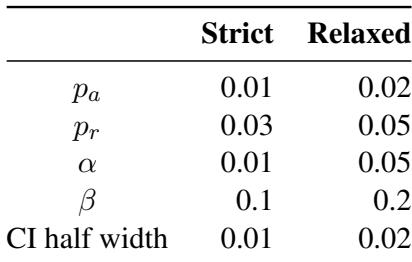
The table defines two target quality regimes, with the strict setting using tighter acceptable error levels and a smaller confidence interval half width than the relaxed setting. The related discussion treats small sample estimates as imprecise because their confidence margins can be large, especially at low sample sizes. It also motivates acceptance sampling on datasets known to contain annotation errors. Strict quality targets are more conservative than relaxed targets across the listed parameters. Smaller sample sizes produce wider uncertainty margins, reducing estimate reliability. The method is applied to annotated datasets where known errors make quality targets relevant.
The table summarizes annotation error statistics for two NLP datasets used in acceptance sampling experiments: CoNLL 2003 and IMDB. CoNLL 2003 is smaller in terms of sentences but has a higher error percentage, while IMDB is much larger and has a lower error percentage. Both datasets provide known error counts suitable for testing sampling-based error estimation on real annotation errors. CoNLL 2003 has a higher annotation error percentage than IMDB. IMDB contains many more sentences while maintaining a relatively lower error rate. Both datasets are used as real-world cases with known annotation errors for acceptance sampling.
The experiments evaluate acceptance sampling under strict and relaxed quality regimes, showing that strict targets are more conservative and small samples yield wider, less reliable uncertainty margins. The method is tested on CoNLL 2003 and IMDB, real datasets with known annotation errors, where CoNLL 2003 is smaller and noisier while IMDB is larger with a lower error rate. These cases demonstrate the approach on real annotation errors across differing sample sizes and error levels.