Command Palette
Search for a command to run...
クレジットカード不正検出予測モデル
概要
One-sentence Summary
This paper presents an unsupervised credit card fraud detection approach that fits an ARIMA model to regular customer spending patterns to identify anomalous deviations, demonstrating better detecting power than K-Means, Box-Plot, Local Outlier Factor, and Isolation Forest on unbalanced datasets.
Key Contributions
- This work proposes an unsupervised time-series framework for credit card fraud detection that relies exclusively on individual customer spending behavior without requiring labeled ground truth data.
- The approach employs an ARIMA model combined with a rolling window mechanism to capture regular transaction patterns and flag statistical deviations as anomalies.
- Evaluations on credit card datasets demonstrate that the proposed method outperforms four established anomaly detection baselines, specifically K-Means, Box-Plot, Local Outlier Factor, and Isolation Forest.
Introduction
The rapid adoption of credit cards has driven a surge in financial fraud, making automated detection systems essential for protecting consumers and financial institutions. While prior research heavily relies on supervised machine learning algorithms, these approaches struggle with severely imbalanced datasets, scarce labeled data, and an inability to adapt to evolving customer spending patterns. To address these gaps, the authors leverage an unsupervised anomaly detection framework that models daily transaction counts per customer using the ARIMA time series model. By applying a rolling window technique, their method identifies deviations from individual spending behavior without requiring ground truth labels, offering a more adaptable solution for continuous fraud monitoring.
Dataset
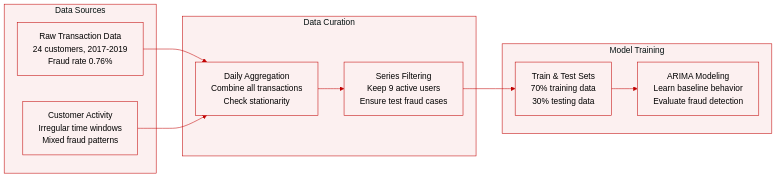
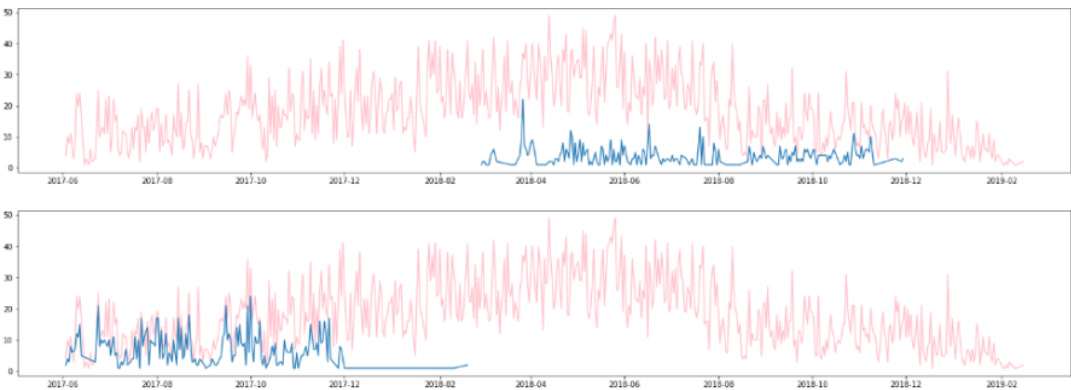
- Dataset Composition and Sources: The authors use a proprietary credit card transaction dataset provided by NetGuardians SA, covering 24 customers of an unnamed financial institution from June 2017 to February 2019. Each record contains a timestamp, transaction amount, and a binary fraud label.
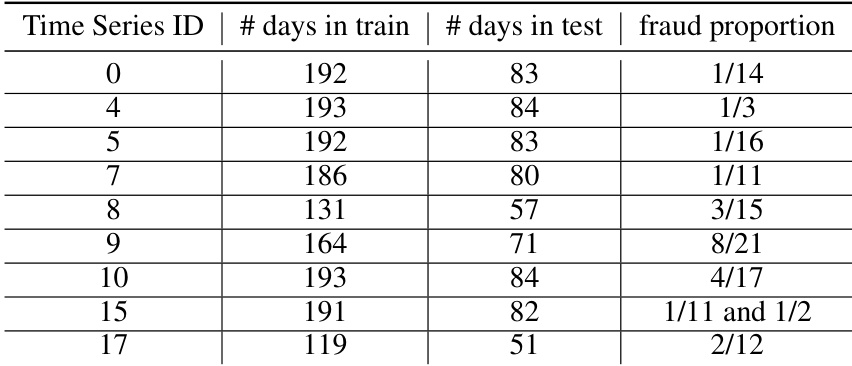
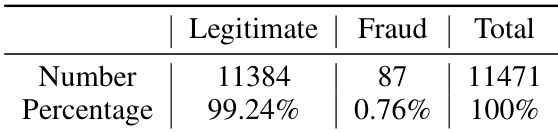
- Subset Details and Filtering: The collection is highly imbalanced, with fraudulent transactions representing only 0.76% of all records. Customer activity is irregular, with some users transacting only during specific time windows. To meet modeling requirements, the authors filter the initial 24 customer sequences down to 9 final time series.
- Training Split and Usage: The data is divided using a 70-30 train-test split. The training phase requires a sufficient volume of legitimate transactions to learn baseline customer behavior, while the test phase must contain at least one fraudulent case for evaluation. This constraint naturally excludes customers whose fraud events fall entirely within the training window.
- Processing and Preprocessing: Transactions are aggregated daily to monitor volume and fraud frequency. The authors apply the Augmented Dickey-Fuller test to verify time series stationarity, applying differencing when necessary. The final nine sequences are formatted for ARIMA modeling, with daily fraud ratios calculated and recorded for each customer.
Method
The authors leverage the Autoregressive Integrated Moving Average (ARIMA) model to detect anomalies in credit card transaction data, focusing on modeling the regular spending behavior of individual customers. The framework is built upon the assumption that fraudulent activity introduces deviations from the expected pattern of daily transaction counts. To achieve this, the ARIMA model is applied to time series data representing the daily number of transactions per customer, aiming to capture the underlying temporal dynamics of legitimate behavior.
The overall process begins with preprocessing the time series to ensure stationarity, which is a fundamental requirement for ARIMA modeling. Stationarity is assessed using the Augmented Dickey-Fuller (ADF) test, and if the series is found to be non-stationary, differencing is applied to achieve stationarity. Once stationarity is confirmed, the model order is determined through the Box-Jenkins methodology, which consists of three main phases: identification, estimation, and diagnostics.
During the identification phase, the autoregressive (AR) order p and moving average (MA) order q are selected using the autocorrelation function (ACF) and partial autocorrelation function (PACF). These functions help distinguish between the decay patterns of the two models: the ACF of an AR(p) process typically tails off, while its PACF cuts off after lag p; conversely, the ACF of an MA(q) process cuts off after lag q, while its PACF tails off. This information guides the selection of appropriate values for p and q.

Once the model order is identified, the estimation phase involves fitting the ARIMA model to the training data using maximum likelihood estimation. This step computes the coefficients ϕ and θ that best describe the observed time series, with the goal of minimizing the prediction error. The resulting model is then evaluated during the diagnostics phase to ensure that the residuals resemble white noise—i.e., they are uncorrelated, normally distributed with zero mean and constant variance. A residual analysis confirms that no temporal structure remains in the errors, indicating a well-fitted model.
For fraud detection, the trained ARIMA model is used to generate one-step-ahead forecasts on the testing set via a rolling window approach. The prediction errors between actual and forecasted transaction counts are computed, and a Z-score is calculated for each error to quantify its deviation from the expected behavior. The Z-score is defined as:
z-score=σx−μwhere x is the prediction error, μ is the mean of the in-sample prediction errors from the training set, and σ is the standard deviation of those errors. A threshold of 3 is applied; any day with a Z-score exceeding this value is flagged as anomalous, indicating a potential fraud.
This approach treats fraud detection as an anomaly detection problem, where deviations from the learned normal pattern are identified as suspicious. The method relies solely on the structure of the time series and does not require labeled fraud data, making it suitable for scenarios where labeled fraud instances are scarce or unavailable. The entire process is applied independently to each customer's transaction time series, allowing for personalized modeling of spending behavior.
Experiment
The evaluation compares an unsupervised ARIMA-based fraud detection model against four benchmark algorithms using both naturally occurring and synthetically augmented transaction datasets to validate performance under varying fraud densities. The experiments demonstrate that the ARIMA approach consistently delivers higher precision and overall reliability by effectively minimizing false positives and adapting to dynamic customer spending patterns through rolling windows. Although benchmark models occasionally achieve superior recall, the proposed method proves more robust for detecting clustered daily fraud attempts. The study concludes that while the model is highly effective, its reliance on equally spaced time intervals requires future refinement to accurately handle irregular transaction timestamps.
The authors compare their ARIMA-based model for credit card fraud detection against several benchmark anomaly detection models, including Box-Plot, Local Outlier Factor, Isolation Forest, and K-Means, using precision, recall, and F-measure as evaluation metrics. Results show that the ARIMA model achieves the highest precision and F-measure, while K-Means performs best in recall, and Local Outlier Factor is the least effective among the benchmarks. The ARIMA model outperforms benchmark models in precision and F-measure. K-Means achieves the best recall among all models. Local Outlier Factor is the least effective benchmark model in the evaluation.

The authors compare their ARIMA-based model to several benchmark anomaly detection methods, including Box-Plot, Local Outlier Factor, Isolation Forest, and K-Means, using multiple time series from credit card datasets. Results indicate that the ARIMA model achieves superior performance in terms of precision and F-measure, while K-Means performs best in recall, and Local Outlier Factor shows the weakest overall performance. The analysis is conducted on a limited set of time series due to low fraud incidence, and robustness is further tested by injecting simulated frauds into the testing data. ARIMA achieves the highest precision and F-measure compared to benchmark models. K-Means provides the best recall, while Local Outlier Factor performs the worst among the models. The ARIMA model's strength lies in modeling normal customer behavior and adapting to dynamic spending patterns through rolling windows.
The authors compare their ARIMA-based model to four benchmark anomaly detection models using three performance metrics. Results show that the ARIMA model achieves the highest precision and F-measure, while K-Means performs best in recall, and Local Outlier Factor shows the lowest performance across most metrics. ARIMA achieves the highest precision and F-measure compared to all benchmark models. K-Means performs best in recall, while Local Outlier Factor has the lowest performance across most metrics. Box-Plot is the only benchmark model that presents comparable F-measure to ARIMA.
{"summary": "The authors compare their ARIMA-based model to several benchmark anomaly detection models on credit card fraud detection tasks. Results show that the ARIMA model outperforms the benchmarks in terms of precision and F-measure, while other models achieve better recall or have limitations in this specific context.", "highlights": ["The ARIMA model demonstrates superior precision and F-measure compared to benchmark models.", "K-Means achieves the highest recall among the models, while Local Outlier Factor performs poorly in precision and F-measure.", "The ARIMA model's effectiveness is attributed to its ability to model dynamic customer spending behavior and detect anomalies during periods of concentrated fraud activity."]
The authors compare the ARIMA model to four benchmark anomaly detection models on credit card fraud detection tasks. Results show that ARIMA achieves the highest precision and F-Measure, while K-Means performs best in recall, and Local Outlier Factor is the least effective among the models tested. ARIMA outperforms benchmark models in precision and F-Measure K-Means achieves the highest recall compared to other models Local Outlier Factor shows the lowest performance across all metrics

The study evaluates an ARIMA-based approach against standard anomaly detection benchmarks using credit card transaction data to assess its capacity for modeling dynamic spending behaviors and identifying fraudulent activity. While clustering techniques demonstrate stronger sensitivity to rare events, the proposed time series framework consistently delivers more reliable detections by effectively tracking normal customer patterns and adapting to fluctuating trends. Robustness testing with simulated anomalies further confirms the model's reliability in sparse fraud environments, establishing it as a highly effective solution for detecting concentrated fraudulent events.