Command Palette
Search for a command to run...
ManiScope: LLM-Assisted Visual Analytics of Cryptocurrency Manipulation Risk
ManiScope: LLM-Assisted Visual Analytics of Cryptocurrency Manipulation Risk
Xiaolin Wen Feng Liang Yuanye Ma Qishuang Fu Zhengyu Sun Feng Zhu Can Liu Yong Wang
Abstract
Cryptocurrency markets are vulnerable to trade-based manipulation, such as wash trading, which can distort price signals and mislead investors. Prior research has mainly focused on detecting manipulation using fixed rules or labeled examples, offering limited flexibility and interpretability for assessing potential risks. Existing visual analytics tools can reveal basic manipulation-related signals, such as token distribution, but still require substantial manual effort to integrate holder relationships, suspicious behaviors, and market dynamics for risk assessment. To address these limitations, we propose ManiScope, an LLM-assisted visual analytics system for analyzing trade-based manipulation risks in cryptocurrency markets. ManiScope provides coordinated views of token distributions, holder relationships, detailed holder behaviors, price dynamics, and suspicious trading patterns. To further enhance user analysis, ManiScope introduces a human–LLM collaborative visual analytics framework. Rather than acting as a basic reactive LLM assistant, the framework positions the LLM as a co-analyst that infers users' analytical intent and emerging hypotheses from interaction context and surfaces relevant visual, statistical, and synthesized evidence for hypothesis evaluation. This design reduces repetitive inspection and strengthens evidence-based reasoning. We evaluate ManiScope through two case studies and a user study with 12 experienced cryptocurrency practitioners. The results suggest that ManiScope supports effective risk assessment of manipulation, reduces manual effort in evidence-seeking, and organizes findings around user hypotheses.
One-sentence Summary
The authors propose ManiScope, an LLM-assisted visual analytics system that coordinates token distributions, holder relationships, suspicious trading patterns, and price dynamics for analyzing trade-based manipulation risks in cryptocurrency markets, and introduces a human–LLM collaborative framework where the LLM acts as a co-analyst inferring user intent and surfacing evidence, thereby reducing manual effort in risk assessment.
Key Contributions
- ManiScope is a visual analytics system that integrates coordinated views of token distributions, multi-level holder relationships, suspicious trading patterns, detailed holder behaviors, and price dynamics to support manipulation risk assessment in cryptocurrency markets.
- The system introduces a human-LLM collaborative visual analytics framework where the LLM acts as a co-analyst, inferring users' analytical intent from interaction context and proactively surfacing relevant visual, statistical, and synthesized evidence to reduce repetitive hypothesis-evidence iteration.
- Two case studies and a user study with 12 experienced cryptocurrency practitioners show that ManiScope supports effective manipulation risk assessment, reduces manual effort in evidence-seeking, and helps organize generated findings around user hypotheses.
Introduction
Cryptocurrency market manipulation, including wash trading and pump-and-dump schemes, causes billions in losses and is hard to assess due to limited oversight. On-chain trading data provides direct evidence, but prior detection methods are retrospective, struggle with evolving strategies, and offer little interpretability, while existing visual analytics tools focus narrowly on single manipulation types or evidence sources, demanding heavy manual effort. The authors propose ManiScope, an LLM-assisted visual analytics system that combines coordinated views of holder distributions, relationships, suspicious trading patterns, and market dynamics with a human-LLM collaborative framework. This framework infers users’ analytical intent and hypotheses from interactions, proactively surfaces relevant findings, and helps users organize evidence to reduce repetitive work and strengthen risk assessment.
Method
The authors develop ManiScope, a system comprising a base visual analytics system and a human-LLM collaborative visual analytics framework. The base system supports flexible evidence modeling and coordinated visualization, while the collaborative framework reduces repetitive hypothesis-evidence iteration and supports rigorous evidence-based reasoning.
As shown in the figure below, the ManiScope interface integrates the base visual analytics system with LLM assistant components.
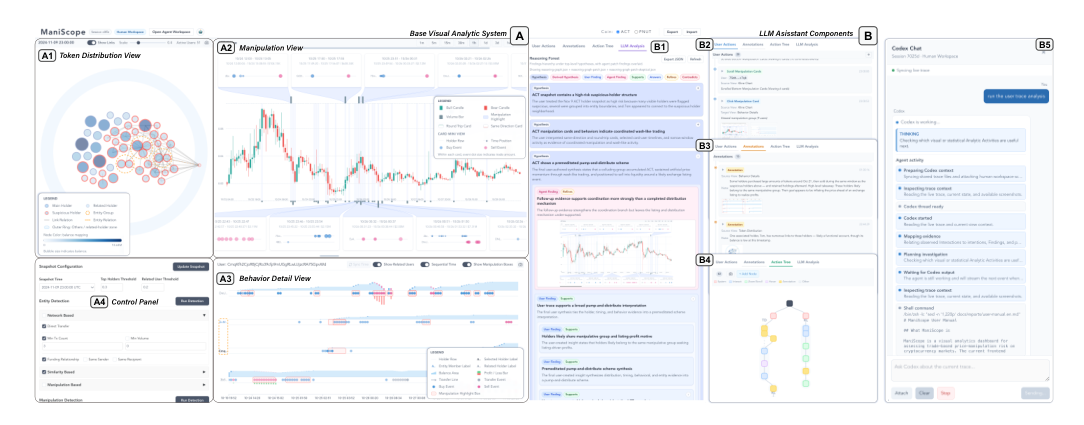
The base visual analytics system is built upon on-chain transaction data, including trades and transfers. To support user-customizable data modeling, the system provides dynamic computation services. The Token Distribution Processing module allows users to select balance snapshots and specify thresholds to filter top holders, aggregating the rest into an Others category. The Entity and Relationship Detection module defines parameterized rules for identifying potential entities and inter-holder relationships based on network, similarity, and suspicious-pattern criteria. The Suspicious Trading Pattern Flagging module applies parameterized rules, such as the Round Trip Rule and Same Direction Rule, to flag potential wash trading and coordinated same-direction trading patterns.
The base visual analytics interface consists of four coordinated components: the Token Distribution View, Manipulation View, Behavior Detail View, and a Control Panel. The Token Distribution View is an enhanced node-link diagram depicting token distributions among top holders and their relationships. The Manipulation View displays price dynamics alongside rule-flagged suspicious trading patterns over time using candlestick and bar charts. The Behavior Detail View presents detailed behaviors of selected holders and related accounts across actions, balance, and earnings over a timeline. The Control Panel supports configurable data processing and evidence modeling.
Building on the base system, the authors propose a human-LLM collaborative visual analytics framework. This framework models the human visual analytics workflow as a hypothesis-driven knowledge generation process and augments it with a context-aware LLM analysis workflow.
Refer to the framework diagram for an overview of the human-LLM collaborative visual analytics framework.
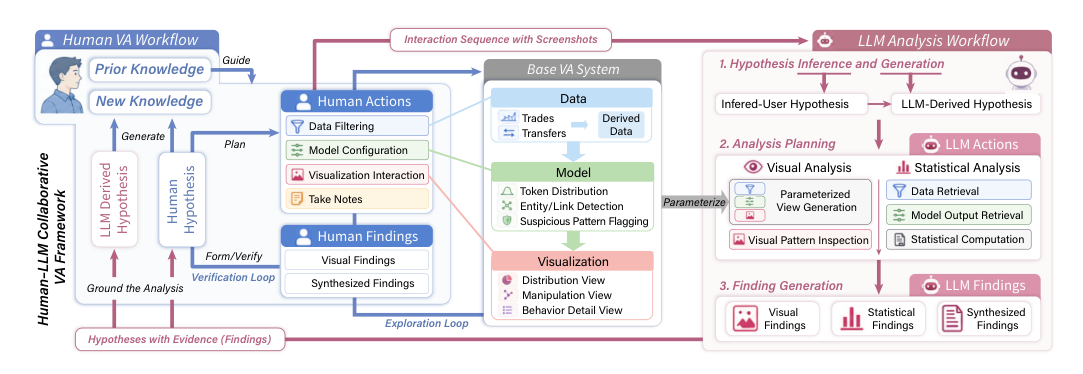
The framework combines a shared data-model-visualization substrate, a hypothesis-driven human visual analytics workflow, and a context-aware LLM analysis workflow. The base visual analytics system instantiates the data, model, and visualization components. The human workflow captures user exploration through filtering, model configuration, visualization interaction, and note-taking. The LLM is embedded into the exploration and verification process as a co-analyst, interpreting user interactions and the current visual context to conduct analyses over the shared analytical substrate.
The LLM workflow operates in three stages: hypothesis inference and generation, analysis planning, and finding generation.
As shown in the figure below, the LLM workflow details these three stages.
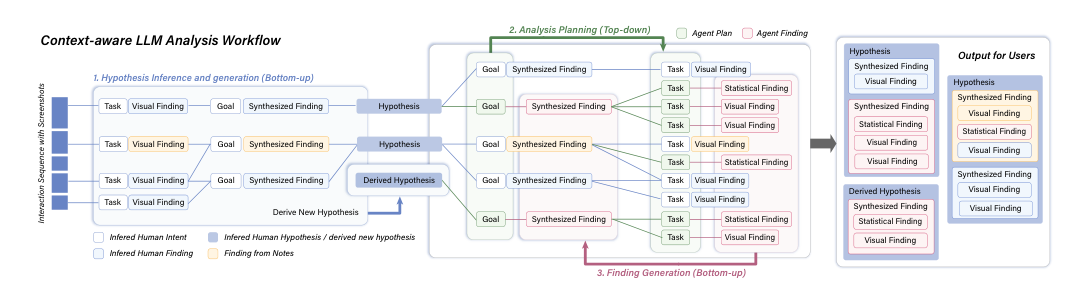
In the Hypothesis Inference and Generation stage, the authors introduce a context-aware bottom-up modeling strategy. The agent takes user interaction sequences with screenshots of the current visual context as input and progressively infers hypotheses from low-level interaction evidence. The modeling process is organized into three levels: interpreting individual interaction actions to infer findings and tasks, aggregating findings into synthesized findings and analytic goals, and inferring the hypothesis the user is forming or attempting to verify. The agent can also derive new hypotheses to extend the reasoning path.
In the Analysis Planning stage, the system identifies gaps in the user's current reasoning and proposes additional directions for verification. The agent performs top-down planning from the current hypothesis and its associated goals, decomposing missing analytical support into visual and statistical operations. The visual branch parameterizes relevant views to inspect suspicious patterns, while the statistical branch retrieves raw data and model outputs for computations.
In the Finding Generation stage, the agent executes the planned tasks using visual analytics or statistical actions. For visual analytic actions, the agent generates visualizations and inspects patterns to obtain visual findings. For statistical actions, the agent retrieves data and executes scripts to obtain statistical findings. These low-level findings are integrated according to the inferred analytic goals and synthesized into structured evidence that supports, contradicts, or refines the current and derived hypotheses.
The system is implemented as a web-based prototype with a Vue front end and a Python/FastAPI backend. The backend manages processed trades and transfers, computes configurable balance snapshots, holder relationships, entities, and suspicious-pattern flags. The LLM workflow uses the same analytical substrate, invoking a model-agnostic LLM backend for hypothesis inference, planning, and finding generation, and executing visual or statistical follow-up actions when evidence is needed.
Experiment
ManiScope was evaluated through case studies with two experienced analysts and a controlled user study with 12 cryptocurrency practitioners comparing it to a baseline reactive LLM assistant. The case studies demonstrated how the system infers hypotheses from user interactions, automatically gathers supporting and contradicting evidence, and reduces manual iteration across views. The user study confirmed that ManiScope's human-LLM collaborative framework significantly improved evidence organization, reduced manual effort, and strengthened evidence-based reasoning, while participants appreciated its active, structured analysis style despite noting increased complexity and a desire for more critical LLM support.
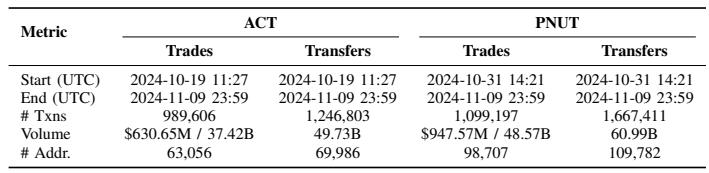
The PNUT token, observed over a shorter 9-day window, recorded higher transaction counts, dollar volume, and unique addresses than ACT, which was tracked for 21 days. Transfer activity exceeded trading activity for both tokens, with PNUT showing particularly intense wallet-to-wallet movement. Despite ACT's earlier start, PNUT's on-chain engagement was markedly higher across all metrics. PNUT's trading volume reached nearly 950Mfromoveramilliontransactions,surpassingACT′sroughly630M from fewer trades, even though PNUT's observation period was less than half as long. Both tokens saw substantially more transfer transactions than trades, with PNUT transfers moving 60.99 billion tokens compared to 48.57 billion in trades, indicating heavy non-exchange movement.
In a user study, ManiScope generated 26 hypotheses and 293 findings, with high alignment and relevance ratings. Most hypotheses were inferred from user interactions, while findings spanned visual, statistical, and synthesized types, reflecting the system's ability to adapt to varied analytical paths. Participants confirmed that the generated content largely matched their reasoning, with over 90% of hypotheses and findings rated as aligned or relevant. Hypotheses were predominantly inferred from user traces (20 of 26), with the remainder derived by the LLM. Generated findings averaged 11.27 per hypothesis and 24.42 per user, with statistical and synthesized findings outnumbering purely visual ones. 96.2% of hypotheses were rated as aligned with user reasoning, and 93.5% of findings were deemed relevant. Finding sufficiency was rated as yes or partial for 92.3% of hypotheses, indicating adequate support for most analysis questions.

Two experiments assess on-chain token activity and a visual analytics system. A comparison of PNUT and ACT tokens over different time windows reveals that PNUT exhibited substantially higher engagement in transactions, volume, and unique addresses, with transfer activity dominating over trading, indicating strong wallet-to-wallet movement. A user study of ManiScope shows that the system generates hypotheses and findings that are highly aligned with user reasoning, with over 90% rated as aligned or relevant, and that most hypotheses are inferred from interaction traces, supporting varied analytical paths.