Command Palette
Search for a command to run...
How to Train a QA Machine Learning Model (BERT)
Abstract
One-sentence Summary
This survey introduces a classification framework that organizes supervised machine learning approaches for learning curve modeling according to the decision-making situations they address, the intrinsic learning curve questions they answer, and the resource types they use, thereby systematizing literature that spans binary performance threshold models to full-curve predictors for applications including data acquisition, early stopping, and model selection.
Key Contributions
- The paper introduces a classification framework that organizes learning curve approaches based on their decision-making contexts, intrinsic predictive questions, and utilized data resources. This structure provides a standardized reference for evaluating algorithm selection and early stopping strategies across parametric and metalearning models.
- A systematic literature survey maps existing extrapolation methods into the proposed taxonomy, categorizing studies that address binary performance comparisons and full curve predictions. This consolidation establishes a cohesive reference for assessing model selection techniques within automated machine learning systems.
- The analysis identifies critical methodological gaps by demonstrating that current approaches rarely benchmark against each other or combine multiple data resource types. These findings highlight opportunities for developing low-level binary prediction methods and multi-resource extrapolation models that integrate tightly with automated machine learning pipelines.
Introduction
Learning curves track a supervised machine learning model's performance against a resource budget, such as training samples or computation time, making them essential for optimizing data acquisition, early stopping, and model selection. Despite their practical value, prior research has produced a fragmented landscape of techniques that range from basic convergence checks to complex parametric extrapolation models. This lack of standardization often results in a mismatch where overly sophisticated modeling methods are applied to simple binary decision questions, while valuable cross-algorithm and cross-dataset resources remain underutilized. To address these challenges, the authors introduce a unified framework that categorizes existing approaches along three dimensions: the decision-making scenario, the specific technical question addressed, and the data resources leveraged. They then conduct an extensive literature survey to map current methods onto this framework, highlighting key research gaps and proposing more efficient, context-aware modeling strategies for automated machine learning pipelines.
Dataset
-
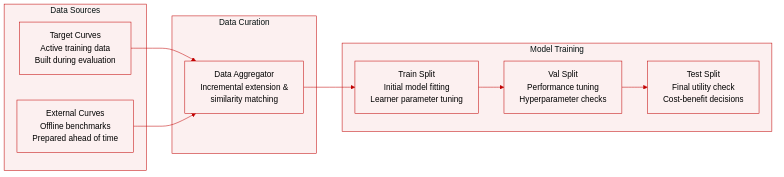
Dataset Composition and Sources: The authors use a synthesized collection of existing resources for learning curve analysis rather than a single proprietary dataset. These sources include empirical curves from target datasets, precomputed curves from external benchmarks, dataset meta-features, and learner-specific features.
-
Key Details for Each Subset: The authors categorize these resources into four conceptual groups instead of fixed subsets. Target dataset curves are generated during active training. External curves are typically available up to large sample sizes or convergence and are prepared offline. Meta-features capture measurable dataset qualities to estimate domain similarity, while learner features describe algorithmic properties to predict performance trajectories.
-
How the Paper Uses the Data: The authors use these resources to model learning curves and address quantitative data acquisition questions, such as determining optimal sample sizes, estimating theoretical performance ceilings, and maximizing utility relative to labeling costs. Partial empirical curves are constructed incrementally and can be extended or discarded based on computational budgets. The framework evaluates a portfolio of admissible learners rather than a single fixed model.
-
Processing Details and Strategy: The authors do not apply specific cropping strategies, mixture ratios, or filtering rules. Instead, they rely on meta-learning and feature-based similarity to guide inference, treating historical curves and measurable dataset properties as inputs for decision-making. The paper explicitly notes that data and code availability are not applicable due to its survey nature.
Method
The framework for learning curve modeling and decision-making revolves around the characterization of a learner's performance as a function of a budget, which can represent either the number of training samples or the number of iterations. The performance, typically measured by a loss function such as error rate, is modeled as a stochastic process f(a,b)∼N(μa,b,σa,b2), where μa,b is the true mean performance and σa,b2 is the aleatoric uncertainty. The primary goal is to construct a model f^a(b) that estimates μa,b for any budget b, enabling predictions beyond the observed data. This process inherently involves coping with two types of uncertainty: aleatoric uncertainty, which is the inherent noise in the performance measurement, and epistemic uncertainty, which is the uncertainty about the model's estimate of the mean. The model's ability to generalize across different budgets and, in more advanced cases, across different learners, is central to its utility.
The core of the modeling process is the construction of a learning curve model, which can be categorized into three levels of complexity based on the type of estimate it provides. The simplest form is a point estimate, where the model f^a(b) returns a single value for the predicted performance at a given budget. This is typically achieved by fitting a parametric function, such as an inverse power law μa,b=α+βb−γ, to a set of empirical observations. While this approach is straightforward, it fails to quantify the uncertainty associated with the prediction. A more sophisticated approach is a range estimate, which provides a confidence interval or interquartile range around the point estimate, thus explicitly modeling the epistemic uncertainty. This is often done by fitting separate models to the quantiles of the empirical distribution. The most comprehensive approach is a distribution estimate, which models the full probability distribution of the true mean performance at any budget. This is frequently achieved using Bayesian methods, such as Gaussian processes or Bayesian neural networks, which provide a probabilistic belief over the space of possible learning curves.

The framework extends beyond simple point predictions to support a variety of decision-making scenarios. These scenarios are organized into three orthogonal dimensions: the decision-making situation, the technical question being asked, and the data resources used. The decision-making situations include data acquisition, early stopping, and early discarding. Early stopping involves halting a training process when a learning curve has converged, while data acquisition involves deciding when to stop collecting data based on the predicted performance of all considered learners. Early discarding, on the other hand, involves eliminating underperforming candidate learners from a portfolio based on their predicted performance. The technical questions that can be answered range from simple binary decisions (e.g., is the performance at a reference point below a threshold?) to more complex queries about the complete shape of the learning curve or utility function. The data resources available can include the learning curve of the target learner, the learning curves of other learners on the same or different datasets, and features describing the datasets or algorithms.

The most general models are those that can predict the performance of any learner at any budget, denoted as C(⋅,⋅). These models are highly versatile and can be used for any of the aforementioned decision-making tasks. They are typically built by generalizing across both learners and budgets. For instance, Freeze-thaw Bayesian Optimization and FABOLAS use Gaussian processes to model the learning curve across different hyperparameter configurations, while other approaches use neural networks or matrix factorization to model the performance landscape. These models can also be extended to incorporate utility, creating a utility curve U that balances performance against costs such as data acquisition or computational time. The utility curve, as shown in the figure below, is derived by combining the predicted performance from the learning curve model with cost functions, and the optimal decision is often made at the peak of this curve.

Another key concept is the capacity curve, which plots the performance of a learner as a function of its model complexity (e.g., number of parameters) for a fixed dataset size. This curve is useful for analyzing the intrinsic noise level of the data and identifying the point at which increasing model capacity no longer improves performance, which is analogous to the saturation point in a sample-wise learning curve. The figure below illustrates this, showing how the performance initially decreases as model capacity increases, reaches a minimum (the intrinsic noise), and then may increase due to overfitting.

Experiment
The evaluation computes empirical learning curves using both sample-wise and iteration-wise approaches on benchmark datasets to compare algorithms such as random forests, neural networks, and support vector machines. These experiments validate how varying training data sizes and optimization iterations influence model error, demonstrating that empirical curves reliably reflect the relative performance rankings of different learners. While the methodology does not yield theoretical generalizations, it provides practical, dataset-specific insights that effectively guide algorithm selection and model comparison.
The the the table presents a classification of learning curve approaches based on the questions they address, the type of learning curve, data resources used, and the estimate type. It categorizes methods by their focus on predicting performance, ranking learners, or estimating utility, and indicates whether they use observational or iterative data, along with the type of estimate produced. The the the table organizes learning curve methods by the type of question they address, such as performance prediction and learner ranking. Approaches are categorized by data usage, including observational and iterative methods, and whether they use dataset or algorithm-specific resources. The the the table distinguishes between different estimate types, such as point, range, and distribution estimates, and their applicability to various learning curve tasks.
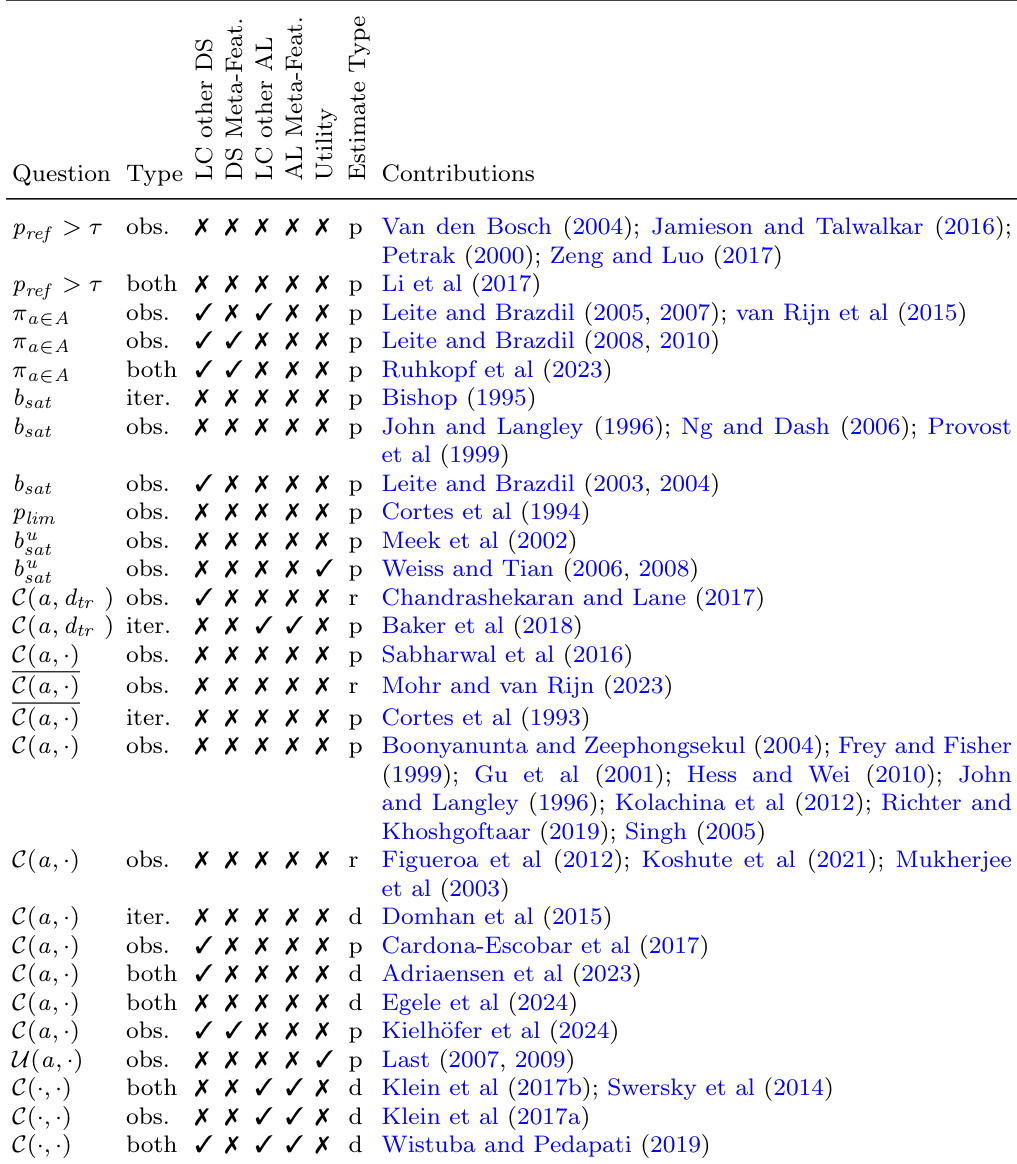
The content presents a structured classification of learning curve methodologies that organizes approaches by their core objectives, including performance prediction, learner ranking, and utility estimation. This framework differentiates methods based on their data requirements, distinguishing between observational and iterative sampling alongside dataset and algorithm-specific resources. It further categorizes techniques by their output formats, covering point, range, and distribution estimates. Ultimately, the taxonomy provides a clear qualitative guide for aligning learning curve selection with specific research objectives and available data constraints.