Command Palette
Search for a command to run...
Der Wert von Prognosen bei der Identifikation der am schlechtesten Gestellten
Der Wert von Prognosen bei der Identifikation der am schlechtesten Gestellten
Unai Fischer-Abaigar Christoph Kern Juan Carlos Perdomo
Zusammenfassung
Maschinelles Lernen wird zunehmend in staatlichen Förderprogrammen eingesetzt, um die verwundbarsten Personen zu identifizieren und zu unterstützen, wobei die gezielte Hilfeleistung für besonders gefährdete Gruppen Vorrang vor der Optimierung aggregierter Ergebnisse hat. Dieser Beitrag untersucht die wohlfahrtsökonomischen Auswirkungen von Prognosen in an Verteilungsgerechtigkeit orientierten Kontexten und vergleicht diese mit anderen Politikinstrumenten, etwa der Ausweitung bürokratischer Kapazitäten. Anhand mathematischer Modelle und einer Realweltnachstudie zur Langzeitarbeitslosigkeit unter den in Deutschland lebenden Personen entwickeln wir ein umfassendes Verständnis der relativen Wirksamkeit von Prognosen bei der Aufdeckung der am schlechtesten Gestellten. Unsere Ergebnisse liefern analytische Rahmenwerke sowie praxisnahe, datengestützte Instrumente, die es politischen Entscheidungsträgern ermöglichen, bei der Gestaltung solcher Systeme prinzipiengeleitete Entscheidungen zu treffen.
One-sentence Summary
Researchers from Harvard's Center for Research on Computation and Society develop analytical frameworks and data-driven tools that evaluate the welfare impact of machine learning prediction in identifying the worst-off, compare its effectiveness against alternative policy levers such as expanding bureaucratic capacity, and validate their approach through a case study on long-term unemployment in Germany.
Key Contributions
-
The paper develops a mathematical framework for equity-driven public-sector allocation by defining a prediction-access ratio that measures the fraction of truly worst-off individuals identified, rather than aggregate expected welfare.
-
The analysis formalizes tradeoffs between predictive accuracy and expanding screening capacity, showing that predictors explaining a constant fraction of variance can yield substantial access ratios and identifying conditions under which local prediction-access ratios exceed one.
-
The paper introduces empirical tools for practitioners and applies them to a German administrative dataset on hundreds of thousands of jobseekers, showing that the theoretical findings generalize to real algorithmic profiling systems and that expanding screening capacity can have a larger impact than improving prediction accuracy.
Introduction
Large public bureaucracies increasingly use risk prediction tools to allocate limited support to people facing adverse outcomes, such as students at risk of dropping out or jobseekers needing assistance. These systems matter because equity driven programs require prioritizing the worst off, not just improving average outcomes, and their real value depends on how they affect bottom line welfare and compare with other policy options.
Prior work often treats prediction accuracy as the main design lever, but it lacks a framework that evaluates statistical prediction together with institutional choices such as expanding screening capacity, caseworker resources, or cost efficiency. This makes it difficult to know whether investing in better models actually helps identify vulnerable people more effectively than simpler administrative changes.
The authors leverage a theoretical prediction access ratio and a real world case study on long term unemployment in Germany to compare the marginal value of better prediction versus broader screening capacity. Their main contribution is a practical framework for determining when prediction systems add the most value, showing that prediction is especially important when models are very weak or nearly perfect, while expanding access often provides greater benefit in realistic middle accuracy regimes.
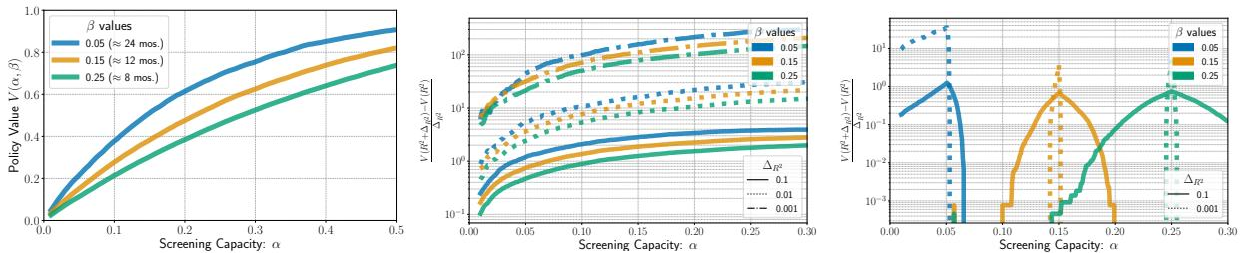
Dataset

- The authors use a German administrative labor-market dataset built by merging multiple public records that cover a large share of the German labor force.
- The data include jobseeker information on employment histories, benefit receipt, unemployment periods, participation in training programs, and demographic attributes.
- For the case study, the authors train a profiling model to predict the unemployment duration of newly registered jobseekers.
- The prediction target is unemployment duration in days, capped at 24 months.
- They restrict the analysis to unemployment spells that begin between 2010 and 2015 to ensure full 24-month follow-up periods and a realistic deployment setting.
- After filtering, the dataset contains 274,515 distinct jobseekers and 553,980 unemployment spells.
- Model inputs consist of covariates covering demographic details, labor-market history, and most recent job information.
- The authors use the model to rank jobseekers and focus on the highest-risk group, defined as the fraction with the longest expected unemployment durations.
- The dataset also supports analysis of long-term unemployment risk, where unemployment lasting more than one year corresponds to about 15 percent of cases in the filtered data.
Method
The authors formulate the allocation problem as a constrained screening decision. The planner chooses a binary rule π:R→{0,1} that determines whether an individual is screened or targeted, using only a predicted welfare outcome Y^. The goal is to maximize the fraction of the worst-off population that is reached, while respecting a resource cap α on the share of the population that can be screened. The objective is
π:R→{0,1}maxE[π(Y^)=1∣Y≤FY−1(β)]s.t.E[π(Y^)]≤α,where FY−1(β) marks the welfare cutoff that defines the worst-off β fraction of the population.
When predictions are perfect and Y^=Y, the optimal policy is straightforward: rank individuals by their true outcomes and select the bottom α fraction. With imperfect predictions, the optimal rule ranks individuals by their conditional probability of belonging to the poor segment. Specifically, define the score
s(Y^)=Pr(Y≤FY−1(β)∣Y^).The optimal screening policy is then
π∗(Y^i)=1{s(Y^i)≥Fs−1(1−α)},which screens the top α share of individuals according to this predicted poverty likelihood.
To obtain tractable policy-value expressions, the authors analyze a Gaussian benchmark in which prediction errors are additive and independent:
Y−Y^∼iidN(0,γ2),Y∼N(μ,η2).In this setting, ranking individuals by predicted outcomes in ascending order and screening the lowest α fraction is optimal. The resulting policy value is
V(π∗)=Pr(Y^≤FY^−1(α)∣Y≤FY−1(β))=βΦ2(Φ−1(α),Φ−1(β);ρ),where Φ2 is the bivariate standard normal CDF, Φ−1 is the standard normal quantile function, and
ρ=ηη2−γ2.The predictive quality is summarized by R2=ρ2, the squared correlation between true and predicted outcomes. The framework can also be applied to log-normal outcomes by taking logarithms, since the logarithm preserves the ordering of outcomes. The corresponding screening policy can be visualized as the probability that an individual with true welfare Y=y is selected under the screening threshold, and the area under this curve corresponds to the policy value. The effect of changing screening capacity versus improving prediction accuracy is shown in the figure below.
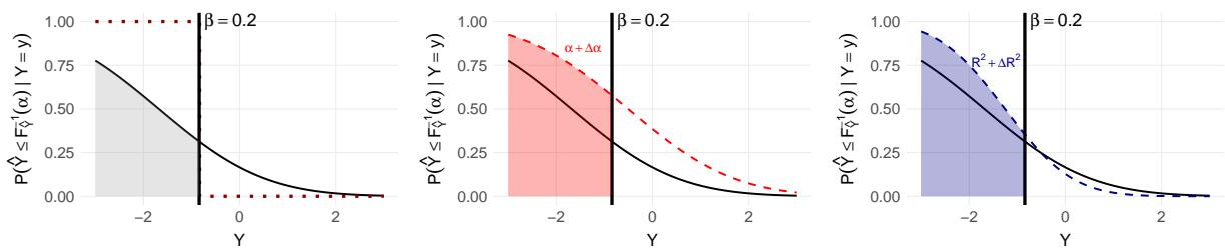
The policy value can be improved through two main levers. The first is expanding access, which raises the screening threshold from α to α+Δα. The second is improving predictions, which raises R2 to R2+ΔR2. Perfect access, α=1, would identify the entire worst-off segment if the policy can screen everyone. Perfect prediction, R2=1, does not by itself eliminate resource constraints, but it allows the available capacity to be allocated optimally.
To compare these levers, the authors define the prediction-access ratio, or PAR:
PAR=V(α,β,R2+ΔR2)−V(α,β,R2)V(α+Δα,β,R2)−V(α,β,R2).This ratio measures the marginal gain in policy value from expanding screening capacity relative to the marginal gain from improving predictive accuracy. A PAR greater than one means that, for the chosen increments, increasing capacity yields a larger improvement than improving predictions. If a cost ratio is considered, the planner can compare the cost-adjusted gain, for example by evaluating a scaled version of the PAR.
The theoretical analysis identifies regimes in which each lever matters most. When screening capacity is very small, small expansions in α can produce large increases in policy value. For small α and a baseline predictive signal bounded away from zero, the PAR can grow rapidly, making access expansion the dominant priority. A lower bound for the local PAR takes the form
PAR≳ΔR2ΔαR2(1−R2)(5.1⋅αΦ−1(1−α))−1/(1−R2)+o(1),where o(1) vanishes as α approaches zero. Because Φ−1(1−α) grows slowly while the power term can amplify small changes, capacity constraints make access improvements especially valuable.
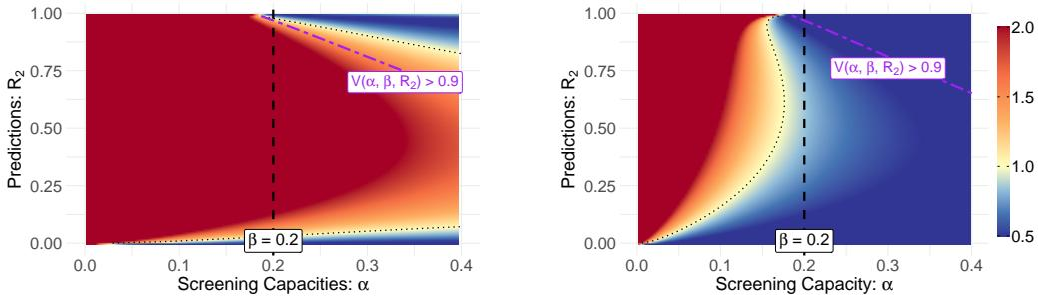
Prediction improvements are most impactful in two opposite regimes. When predictive accuracy is very low, even a small initial improvement in R2 can create a large first-order gain, provided that some baseline screening capacity exists. When R2 is already very high, further gains can also become important if the screening capacity α is close to the level needed to cover the full worst-off segment β. Numerical simulations of the PAR across (α,R2) space illustrate how the relative value of the two levers changes across these regimes. The left panel maps raw PAR values, while the right panel can be interpreted as a cost-adjusted version under a specified ratio. Regions where PAR exceeds one favor capacity expansion, while regions where PAR is below one favor prediction improvement.
For real-world systems, the authors develop an empirical evaluation pipeline based on the same definitions. The policy value is estimated with a recall-like metric:
V(α,β)≈∑i=1n1{Yi≤FY,n−1(β)}∑i=1n1{Y^i≤FY^,n−1(α)}1{Yi≤FY,n−1(β)}.This quantity measures the proportion of truly worst-off individuals who are selected by the screening rule. Expanding capacity is evaluated by increasing α and recomputing the empirical policy value at the new threshold. This can also be inverted to answer a practical budgeting question: given a target coverage level p, the required capacity is
α∗=α∈(0,1)inf{α:V(α,β)≥p}.Improving predictions can be modeled through several channels. The decision-maker may collect more data, reduce missingness or measurement error, add new features by integrating data sources, or adopt stronger modeling techniques. For incremental evaluation, the authors simulate a modest prediction improvement by shrinking model residuals:
Y^+=Y^+δ(Y−Y^),0<δ<1.This transformation produces a model that is slightly better but preserves the existing error structure, allowing the analyst to estimate how a small increase in R2 changes the policy value. Alternative implementations can retrain the model under different data conditions, adjust residuals for subgroups to represent targeted data improvements, or compare distinct model architectures. The final empirical step compares the resulting marginal gains from capacity expansion and prediction improvement, yielding an empirical PAR that can guide operational investment decisions.
Experiment
The evaluation compares policy-value gains from increasing screening access versus improving predictive accuracy, using theoretical bounds, numerical simulations, and a German unemployment case study. These experiments validate that expanding capacity is most valuable when screening is scarce, while prediction improvements become comparatively important when accuracy is very low or very high and access is sufficient. They also show that gains from model complexity can be translated into required screening expansions, indicating that practical priorities should depend on the existing capacity and predictive baseline.