Command Palette
Search for a command to run...
Eine modulare Zero-Shot-Pipeline zur Unfallerkennung, -lokalisierung und -klassifizierung in Verkehrsüberwachungsvideos
Eine modulare Zero-Shot-Pipeline zur Unfallerkennung, -lokalisierung und -klassifizierung in Verkehrsüberwachungsvideos
Amey Thakur Sarvesh Talele
Zusammenfassung
Wir beschreiben eine Zero-Shot-Pipeline, die für die ACCIDENT @ CVPR 2026 Challenge entwickelt wurde. Die Challenge verlangt, vorherzusagen, wann, wo und welche Art von Verkehrsunfall in Überwachungsvideos auftritt, ohne gelabelte reale Trainingsdaten. Unsere Methode zerlegt das Problem in drei unabhängige Module. Das erste Modul lokalisiert die Kollision zeitlich, indem es eine Spitzenerkennung auf z-score-normalisierten Bilddifferenzsignalen durchführt. Das zweite Modul bestimmt den Aufprallort, indem es den gewichteten Schwerpunkt kumulativer dichter optischer Flussmagnitudenkarten mit dem Farneback-Algorithmus berechnet. Das dritte Modul klassifiziert den Kollisionstyp, indem es die Kosinusähnlichkeit zwischen CLIP-Bildeinbettungen von Frames nahe des erkannten Peaks und Texteinbettungen misst, die aus Multi-Prompt-Beschreibungen in natürlicher Sprache für jede Kollisionskategorie erzeugt werden. Es erfolgt kein domänenspezifisches Feintuning; die Pipeline verarbeitet jedes Video ausschließlich mit vortrainierten Modellgewichten. Unsere Implementierung ist öffentlich als Kaggle-Notebook verfügbar [Thakur und Talele, 2026].
One-sentence Summary
For the ACCIDENT @ CVPR 2026 challenge, independent researchers propose a modular zero-shot pipeline that detects accident timing via peak detection on z-score normalized frame-difference signals, localizes impact using the weighted centroid of cumulative Farneback optical flow magnitude maps, and classifies collision types through CLIP image-text cosine similarity, all without domain-specific finetuning.
Key Contributions
- A modular zero-shot pipeline is introduced for the ACCIDENT @ CVPR 2026 challenge, separating traffic accident analysis into independent temporal, spatial, and collision-type modules that rely only on pre-trained model weights.
- The temporal module localizes the collision via z-score peak detection on frame-difference signals, and the spatial module estimates the impact point by accumulating Farneback optical flow, applying 90th-percentile thresholding, and returning the weighted centroid.
- A CLIP-based classification module matches image embeddings from frames around the detected peak against multi-prompt text embeddings of the five collision categories, and the full pipeline achieves a public leaderboard score of 0.2523 without domain-specific fine-tuning.
Introduction
Road traffic crashes kill over one million people each year, and surveillance cameras already record many of these events, so automated analysis could provide faster emergency alerts and objective scene reconstructions. Prior accident detection methods usually require supervised training on annotated video from the same deployment environment, making them expensive to transfer across different cameras, lighting, and traffic patterns. The ACCIDENT @ CVPR 2026 competition intensifies this challenge by allowing only synthetic CARLA videos for development and prohibiting manual annotation of the real CCTV test set. To address this, the authors propose a modular zero-shot pipeline with independent modules for temporal localization, spatial impact-point estimation, and collision-type classification, using statistical frame-difference anomaly detection, dense optical flow centroids, and CLIP-based text-image matching.

Dataset
-
Sources and composition:
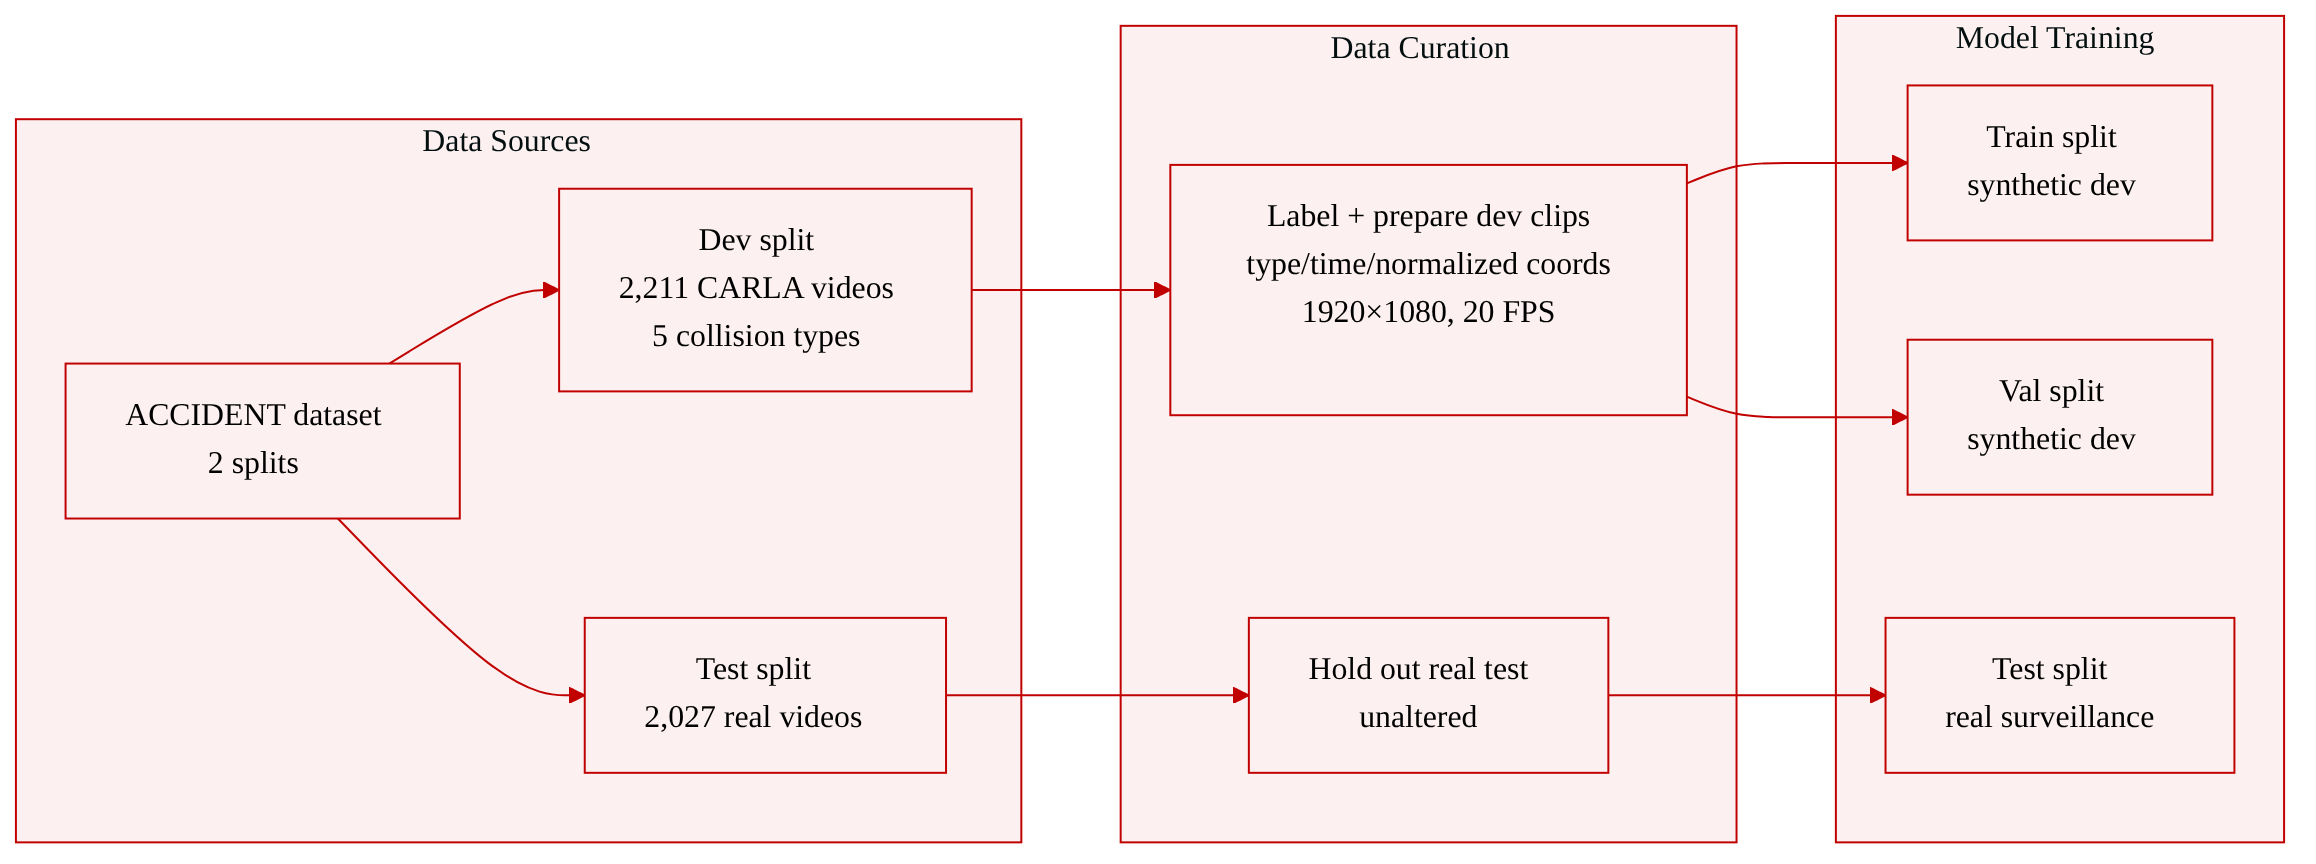
- The paper uses the ACCIDENT @ CVPR 2026 dataset.
- It has two splits: development and test.
- Development split: 2,211 synthetic CCTV-style videos generated with the CARLA simulator.
- Test split: 2,027 real surveillance recordings from public traffic camera feeds.
-
Development split details:
- Five collision categories with counts: rear-end 794, head-on 588, sideswipe 405, t-bone 358, single-vehicle 66.
- Annotations include accident time, impact coordinates, and collision type.
- Synthetic videos are rendered at 1920 x 1080 resolution with a fixed 20 FPS frame rate.
- Clip durations range from 5.8 to 32.2 seconds, with a mean of 17.7 seconds and standard deviation of 3.9 seconds.
- Accident time occurs at a median of 6.9 seconds into the clip, with an interquartile range of 5.2 to 9.8 seconds, placing most collisions in the first half.
- Impact coordinates are normalized 2D coordinates and cluster toward the frame center: c_x and c_y both have means near 0.50, with standard deviations of 0.13 and 0.18.
-
Test split details:
- 2,027 real surveillance recordings.
- Resolution, frame rate, and lighting vary across videos.
- Compression artifacts, lens distortion, and partial occlusion are common.
- The test split may not be annotated by hand, so methods must generalize from the synthetic domain or from general-purpose pre-training alone.
-
Processing and usage:
- The development split serves as the labeled synthetic source for training and validation.
- The test split is the real-world evaluation set.
- The excerpt does not describe additional filtering rules, cropping strategy, or training mixture ratios.
- The main processing details provided are fixed CARLA rendering resolution and frame rate, normalized impact coordinates, and temporal accident annotations.
Method
The authors formulate the accident detection task as predicting a tuple (t∗,cx∗,cy∗,k∗), representing the accident time in seconds, the normalized image coordinates of the impact point, and the collision type from a predefined set K={head-on,rear-end,sideswipe,single,t-bone}. The pipeline is decomposed into three distinct modules: temporal peak detection for time estimation, spatial impact localization for coordinate prediction, and collision type classification using a pre-trained vision-language model.
To estimate the accident time, the authors exploit the sudden intensity changes caused by collisions. They construct a one-dimensional signal from per-frame brightness differences. Given a grayscale frame It∈RH×W resized to H=180 and W=320, the mean absolute difference between adjacent frames is computed as:
dt=HW1u=1∑Hv=1∑W∣It+1(u,v)−It(u,v)∣This raw signal contains both collision signals and background noise. To suppress short-lived noise from camera shake or ordinary traffic, a centered rolling mean with window w=5 is applied:
dˉt=∣Wt∣1s∈Wt∑dswhere Wt={s:∣s−t∣≤⌊w/2⌋}. The smoothed values are then normalized into z-scores using the series-wide mean μ and standard deviation σ:
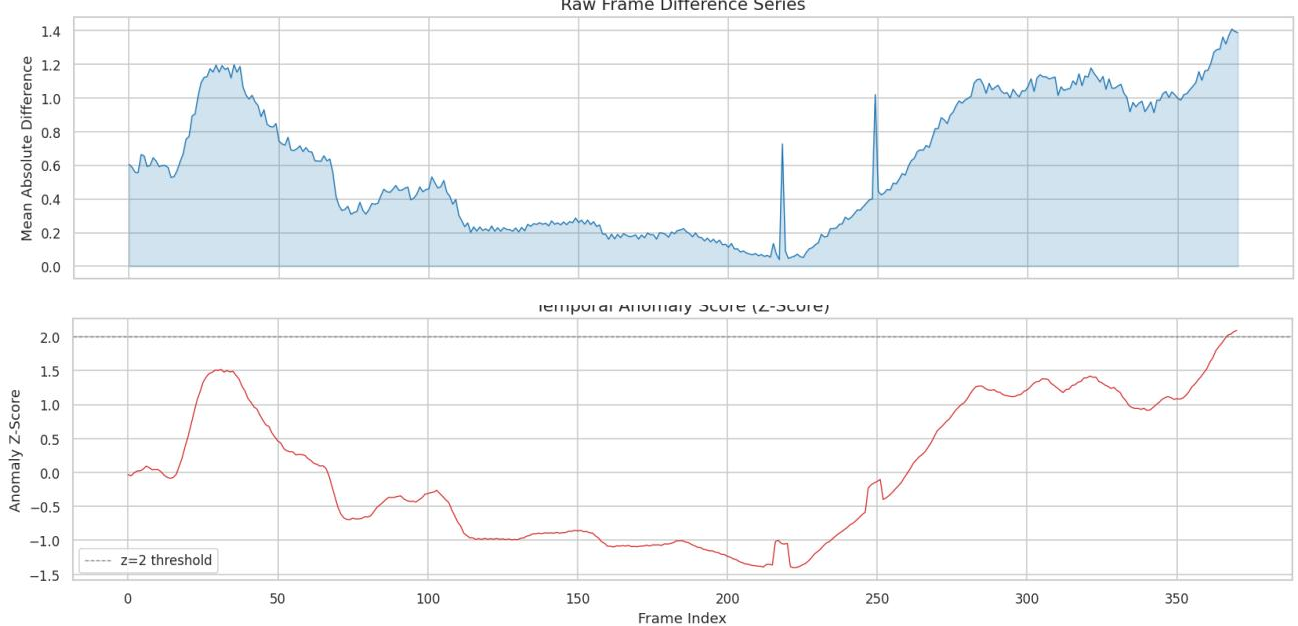
zt=σ+εdˉt−μwith ε=10−8. Frames with zt exceeding a threshold τ=1.5 are treated as anomaly candidates. The frame with the highest anomaly score among these candidates is selected as the accident frame index tframe∗. If no frame crosses the threshold, the global maximum is selected. The final time prediction is t∗=tframe∗/f.
As shown in the figure below, the raw frame-difference series contains a mixture of gradual intensity drift and sharp transients. After smoothing and normalization, the collision event stands out as a distinct peak while background variation remains below the detection threshold.
Once the accident time is identified, the authors localize the impact point by accumulating dense optical flow over a short window. A 30-frame window is centered on the predicted accident frame index (or starting at ⌊N/3⌋ if time is unavailable). The Farneback dense optical flow algorithm is run at 320×180 resolution for consecutive frames within this window. The displacement magnitudes are summed to create a magnitude map:
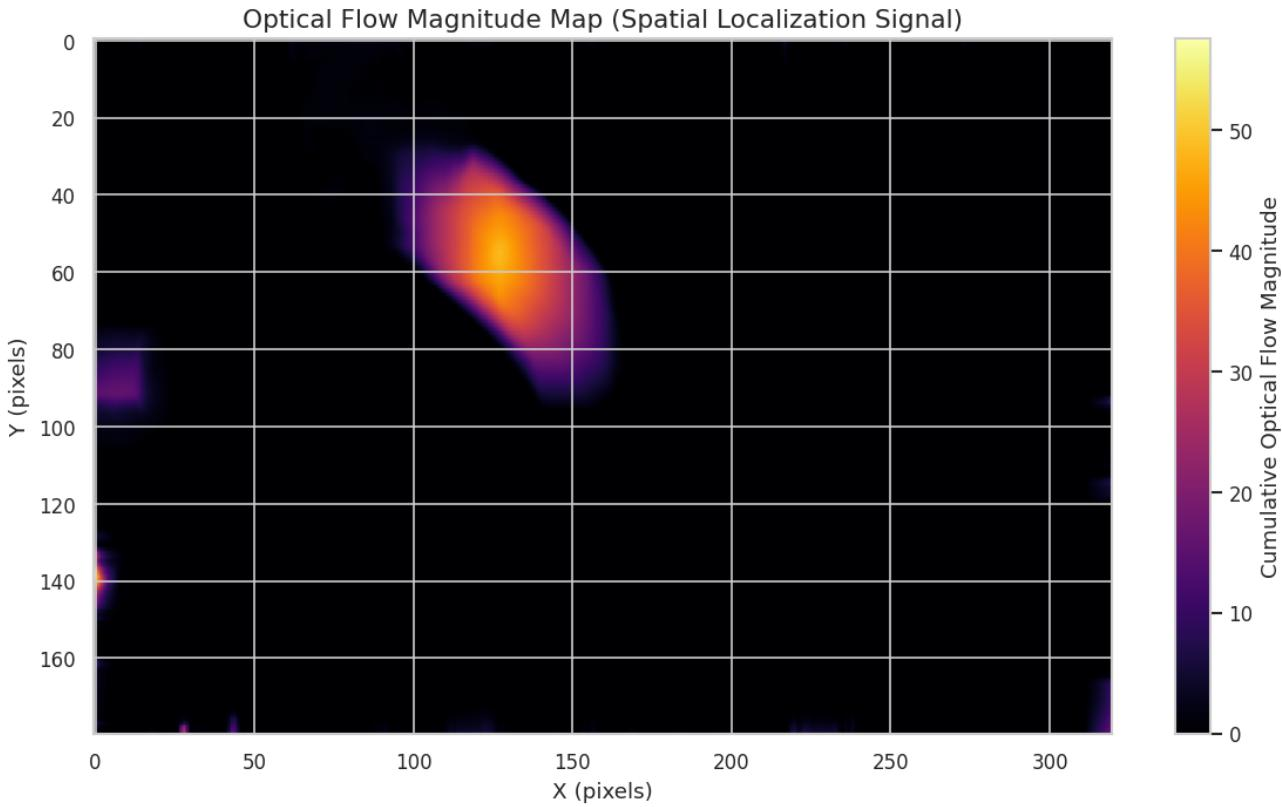
M(u,v)=t∑fx2(u,v,t)+fy2(u,v,t)To suppress diffuse background motion, a percentile threshold at the 90th percentile of M is applied, zeroing out lower values. The impact location is then calculated as the weighted centroid of the thresholded map, normalized to unit coordinates:
cx∗=W1∑u,vM(u,v)∑u,vv⋅M(u,v),cy∗=H1∑u,vM(u,v)∑u,vu⋅M(u,v)If the sum of magnitudes is negligible, the frame center (0.5,0.5) is returned.
Refer to the framework diagram below, which illustrates the accumulation result. The collision region concentrates most of the optical flow energy into a compact spatial cluster. After percentile thresholding, the weighted centroid falls within that cluster to provide a localized impact coordinate.
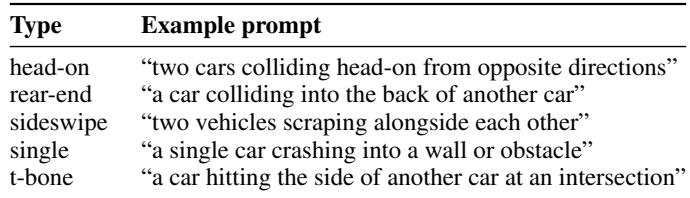
For collision type classification, the authors leverage CLIP, a pre-trained vision-language model. For each collision type k∈K, five natural language descriptions {pk1,…,pk5} are written to characterize the collision from a bystander perspective. Each prompt is encoded by the CLIP text encoder ϕtext, L2-normalized, and averaged to form a class text embedding:
tk=51j=1∑5∥ϕtext(pkj)∥ϕtext(pkj)At inference time, eight video frames centered on the predicted accident time t∗ are extracted and fed into the CLIP visual encoder. Each image embedding is L2-normalized and averaged into a single representation:
v=81i=1∑8∥ϕimg(Iti)∥ϕimg(Iti)The predicted collision type is the class with the highest cosine similarity to the video representation:
k∗=argk∈Kmaxv⋅tkExperiment
The experiments evaluate a training-free CLIP-based pipeline on the ACCIDENT dataset, using synthetic CARLA clips for development and real CCTV surveillance videos for testing, with submissions scored by a harmonic mean of temporal, spatial, and collision-type accuracy. Since no model weights are trained or fine-tuned, the setup validates generalization from synthetic data or general-purpose pre-trained features. Qualitatively, the method can estimate accident time and location well when it detects the correct event, but collision classification is unreliable, likely because CLIP responds to viewpoint and scene geometry rather than collision dynamics. Error analysis attributes failures to large background motion, simultaneous multi-vehicle movement, and overhead or oblique camera angles.
Prompt templates define five collision types: head-on, rear-end, sideswipe, single, and t-bone. For each type, five natural language descriptions are encoded with CLIP, normalized, and averaged into one text embedding to reduce sensitivity to individual wording. In practice, this classification component struggles on real CCTV data, often predicting t-bone for head-on examples and shifting overall predictions toward sideswipe and single categories. Five prompts per collision type are averaged into a single CLIP text embedding to reduce dependence on any one wording. The prompt set covers head-on, rear-end, sideswipe, single, and t-bone collision types. On a calibration subset, all head-on videos were predicted as t-bone by the CLIP-based classifier. Across the full test set, sideswipe was the most predicted category and rear-end was the least predicted, opposite to the rear-end-heavy synthetic training distribution.
Pipeline hyperparameters were selected by visual inspection on synthetic videos and held fixed across all test videos. Temporal detection uses a five-frame smoothing window and a 1.5 z-score threshold, while spatial localization uses a 30-frame context window with multi-scale pyramid processing. In evaluation, the pipeline achieves a modest leaderboard score, and although individual temporal and spatial predictions can be accurate, classification failure drives the composite score to zero through the harmonic mean. Temporal and spatial hyperparameters were fixed across all test videos after visual inspection rather than tuned per video. The predicted collision type distribution on real CCTV is dominated by sideswipe and single-vehicle categories, whereas the synthetic training split is dominated by rear-end collisions. Error analysis attributes temporal localization failures to background motion, spatial drift to multiple moving vehicles, and misclassification to viewpoint differences between synthetic renders and real CCTV footage.
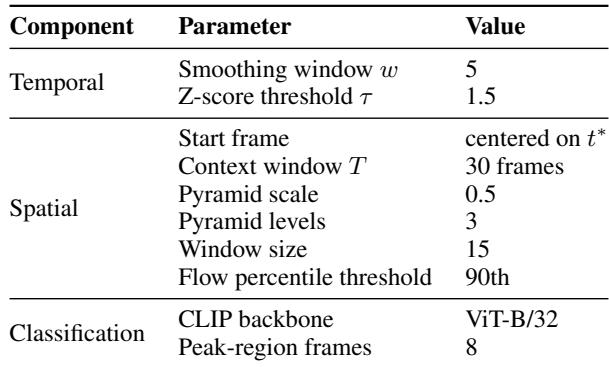
The experiments evaluate a CLIP-based collision classifier and a fixed-parameter temporal/spatial detection pipeline on synthetic and real CCTV video. Five prompt embeddings per collision type are averaged to reduce wording sensitivity, but the classifier struggles on real data, misclassifying head-on cases as t-bone and shifting predictions toward sideswipe and single-vehicle categories despite a rear-end-heavy synthetic training distribution. Temporal and spatial parameters are selected by visual inspection and held constant, yielding modest individual predictions, yet classification failure drives the composite score to zero through the harmonic mean. Error analysis attributes temporal localization failures to background motion, spatial drift to multiple moving vehicles, and misclassification to viewpoint differences between synthetic renders and real CCTV footage.