Command Palette
Search for a command to run...
لا يوجد محتوى عربي في النص المطلوب ترجمته، حيث أن العنوان المقدم مكتوب باللغة الإنجليزية. ومع ذلك، وبناءً على طلبك للرد باللغة العربية مع الحفاظ على المصطلحات التقنية كما هي، فإن الترجمة العلمية للعنوان هي:
QuitoBench: معيار مفتوح عالي الجودة للتنبؤ بالسلاسل الزمنية
لا يوجد محتوى عربي في النص المطلوب ترجمته، حيث أن العنوان المقدم مكتوب باللغة الإنجليزية. ومع ذلك، وبناءً على طلبك للرد باللغة العربية مع الحفاظ على المصطلحات التقنية كما هي، فإن الترجمة العلمية للعنوان هي: QuitoBench: معيار مفتوح عالي الجودة للتنبؤ بالسلاسل الزمنية
Siqiao Xue Zhaoyang Zhu Wei Zhang Rongyao Cai Rui Wang Yixiang Mu Fan Zhou Jianguo Li Peng Di Hang Yu
الملخص
تُعد التنبؤات السلاسل الزمنية حاسمة في مجالات التمويل والرعاية الصحية والحوسبة السحابية، غير أن التقدم فيها مقيد بعقبة جوهرية: ندرة المعايير التقييمية (benchmarks) واسعة النطاق وعالية الجودة. ولمعالجة هذه الفجوة، نقترح تقديم QuitoBench، وهو معيار تقييم متوازن إداريًا (regime-balanced) للتنبؤ بالسلاسل الزمنية، يغطي ثمانية أنماط من اتجاهات السلاسل الزمنية والموسمية وقابلية التنبؤ (TSF)، صُمم لالتقاط الخصائص ذات الصلة بالتنبؤ بدلاً من الاعتماد على تسميات المجالات المحددة مسبقًا بالتطبيقات. بُني هذا المعيار على أساس Quito، وهو مستودع ضخم للسلاسل الزمنية يحتوي على مليارات السجلات لبيانات حركة المرور التطبيقية من منصة Alipay، ويمتد عبر تسعة مجالات تجارية. ومن خلال تقييم 10 نماذج تشمل نماذج التعلم العميق والنماذج الأساسية (foundation models) والنماذج الإحصائية المرجعية عبر 232,200 حالة تقييمية، توصلنا إلى أربع نتائج رئيسية: (i) وجود نقطة تقاطع تعتمد على طول السياق (context-length crossover)، حيث تتفوق نماذج التعلم العميق في السياقات القصيرة (L=96) بينما تهيمن النماذج الأساسية في السياقات الطويلة (L ≥ 576)؛ (ii) تُعد قابلية التنبؤ (forecastability) العامل المهيمن في تحديد صعوبة المهمة، مما يولد فجوة في متوسط الخطأ المطلق (MAE) تبلغ 3.64 مرة عبر الأنماط المختلفة؛ (iii) تتفوق نماذج التعلم العميق أو تُطابق أداء النماذج الأساسية بعدد معاملات أقل بـ 59 مرة؛ و(iv) يُوفر زيادة حجم بيانات التدريب فائدة أكبر بكثير مقارنة بزيادة حجم النموذج لكلتا العائلتين. وقد تم التحقق من هذه النتائج من خلال اتساق قوي عبر معايير تقييمية مختلفة وقياسات متعددة. كما أن إصدارنا المفتوح المصدر يمكّن من إجراء تقييمات قابلة للتكرار وواعية بالأنماط (regime-aware) لأبحاث التنبؤ بالسلاسل الزمنية.
One-sentence Summary
Ant Group researchers introduce QUITO-BENCH, a regime-balanced benchmark built on a billion-scale Alipay corpus, to address data scarcity in time series forecasting. It reveals that forecastability drives difficulty and that scaling data outperforms model size, enabling reproducible evaluation across finance and cloud computing.
Key Contributions
- The paper introduces QUITO-BENCH, a regime-balanced benchmark that categorizes time series by intrinsic statistical properties like trend, seasonality, and forecastability rather than application domains to ensure uniform coverage across eight distinct forecasting regimes.
- A billion-scale, single-provenance time series corpus named QUITO is presented, featuring uniformly long series from Alipay that eliminate information leakage and support rigorous evaluation at context lengths up to 1,024.
- Extensive experiments across 232,200 evaluation instances reveal that deep learning models outperform foundation models at short contexts while foundation models dominate at long contexts, and that scaling training data yields greater benefits than scaling model size.
Introduction
Time series forecasting is essential for high-stakes decisions in finance, healthcare, and cloud computing, yet the field faces an evaluation crisis due to a lack of large-scale, high-quality benchmarks. Prior work suffers from coarse domain-based categorization that ignores intrinsic data properties, severe distributional skew where most data falls into a single regime, and information leakage from reusing public datasets across training and testing pipelines. To address these issues, the authors introduce QUITOBENCH, a regime-balanced benchmark built on QUITO, a billion-scale time series corpus from Alipay that ensures leakage-free evaluation across eight distinct trend, seasonality, and forecastability regimes. This new standard enables rigorous comparison of deep learning and foundation models, revealing that forecastability drives difficulty and that data scaling offers greater benefits than increasing model size.
Dataset
-
Dataset Composition and Sources The authors construct the QUITO corpus from production traffic telemetry on Alipay, a major digital payment platform. The data spans nine business verticals, including finance, commerce, and infrastructure, ensuring diversity across a full-scale digital economy rather than a single narrow domain. Each series represents the workload of a distinct application service, recorded as a 5-dimensional vector of anonymized traffic subtypes.
-
Key Details for Each Subset The corpus is divided into two disjoint subsets with no overlap in application identifiers:
- QUITO-MIN: Contains 22,522 series at 10-minute resolution spanning from July 10, 2023, to August 19, 2023. This subset reflects high-frequency telemetry subject to shorter retention windows.
- QUITO-HOUR: Contains 12,544 series at 1-hour resolution spanning from November 18, 2021, to August 19, 2023. This subset consists of long-term archived hourly aggregates.
- QUITOBENCH: A curated evaluation benchmark derived from the full corpus, containing 1,290 test series (773 from QUITO-MIN and 517 from QUITO-HOUR) selected to ensure balanced representation across different time series behaviors.
-
Data Usage and Processing Strategy The authors employ a rigorous pipeline to prepare the data for training and evaluation:
- Aggregation: Raw 1-second telemetry is aggregated into 10-minute or 1-hour bins using max pooling to preserve workload peaks.
- Sanitization: The authors apply a two-stage deduplication process to remove exact and near-duplicate series (Pearson correlation > 0.99) and standardize the 5 variates.
- Regime Labeling: Each series is characterized by a TSF profile (Trend, Seasonality, Forecastability) using STL decomposition and spectral entropy. These metrics are binarized to assign one of eight discrete regime labels.
- Benchmark Construction: To prevent evaluation bias toward common patterns, the authors use stratified sampling to select approximately 162 series per regime cell for QUITOBENCH, ensuring near-uniform coverage of all eight behavioral types.
-
Splitting and Leakage Prevention The authors enforce a global temporal cutoff at July 28, 2023, to guarantee leakage-free splits across both granularities. Data prior to this date is divided into training (80%) and validation (20%) sets, while data from the cutoff onward forms the test set. This chronological ordering ensures that no future information contaminates the training process.
Method
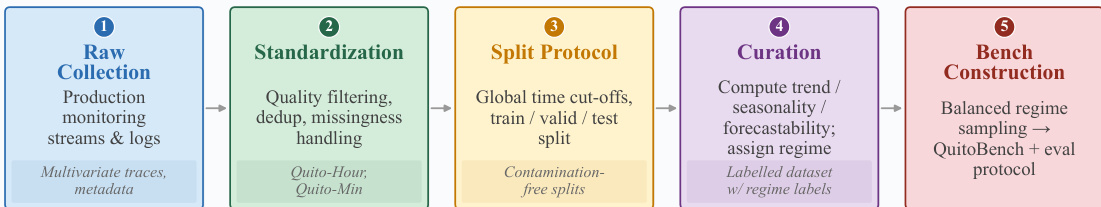
The authors leverage a structured pipeline to construct a robust time series forecasting benchmark, ensuring contamination-free evaluation and diverse regime coverage. The overall workflow, illustrated in the framework diagram, proceeds through five distinct stages: Raw Collection of production monitoring streams, Standardization involving quality filtering and deduplication, Split Protocol to establish global time cut-offs, Curation to compute dynamic regime labels, and finally Bench Construction to create a balanced evaluation set.
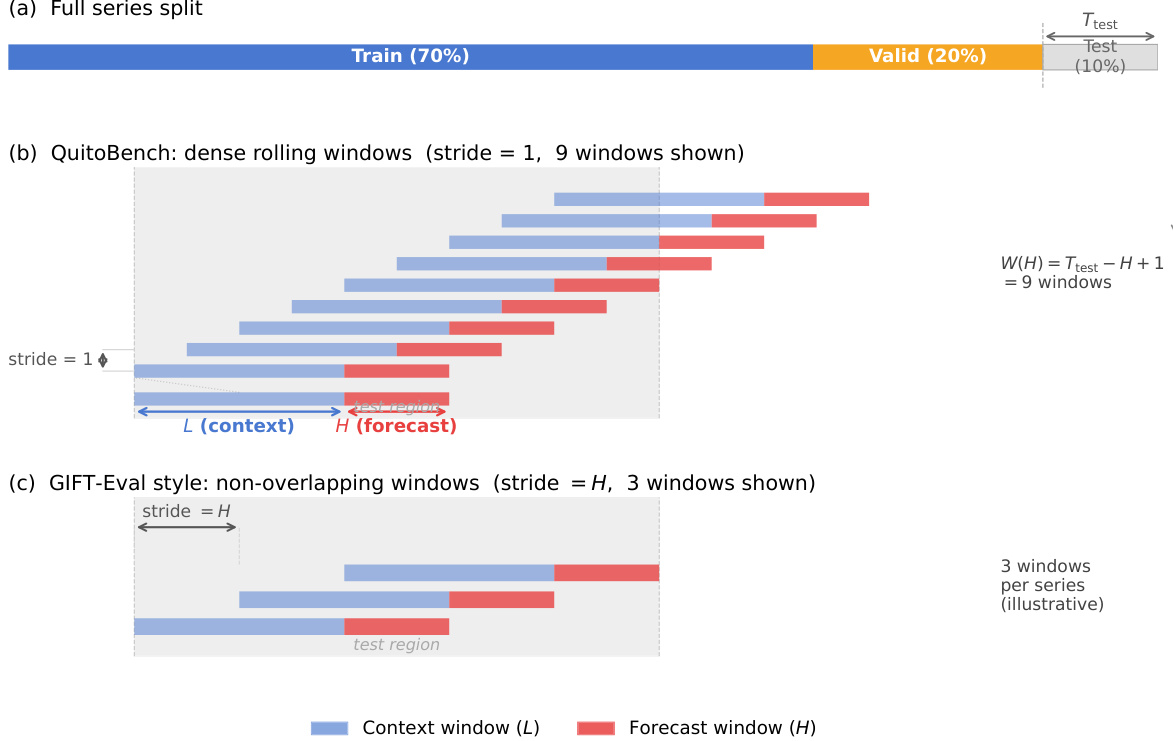
To ensure rigorous evaluation, the data is partitioned using a global time cut-off strategy. As shown in the figure below, the full series is split into training (70%), validation (20%), and test (10%) sets. For the QuitoBench protocol, the authors employ dense rolling windows with a stride of 1 to maximize data utilization during the test phase, contrasting with the non-overlapping windows used in GIFT-Eval style evaluations. This approach generates multiple context-forecast pairs (L and H) from the test region, allowing for a more granular assessment of model performance across different temporal horizons.
A core component of the curation process involves characterizing the dynamic regime of each time series using three scalar diagnostics: trend strength (T), seasonality strength (S), and forecastability (F). Each metric is bounded within [0,1], where higher values indicate a stronger presence of the respective property.
To quantify trend and seasonality, the authors decompose each univariate series {xt} using Seasonal-Trend decomposition via LOESS (STL). This produces three additive components:
xt=τt+st+rt.Here, τt represents the trend, st the seasonal component, and rt the residual. The strength of seasonality (S) and trend (T) are defined based on the variance of these components:
S=max(0, 1−Var(s+r)Var(r)),T=max(0, 1−Var(τ+r)Var(r)).A value near 1 implies the component dominates the residual, while a value near 0 suggests the component is negligible relative to noise. The seasonal period p is determined by the series resolution, set to 144 for QUITO-MIN and 24 for QUITO-HOUR.
Forecastability is measured as the complement of normalized spectral entropy. Using Welch's method with a Hann window, the power spectral density Pk is computed for the mean-subtracted series. The normalized entropy H is calculated as:
H=−k∑p^klogp^k/logK,p^k=∑jPjPk,where K is the number of frequency bins. Forecastability is then defined as F=1−H, where F=1 indicates a perfectly deterministic series and F=0 corresponds to white noise.
Since each series is multivariate with five variates, the authors compute T, S, and F independently for each channel and aggregate them by averaging:
Ti=51j=1∑5Ti,j,Si=51j=1∑5Si,j,Fi=51j=1∑5Fi,j.Finally, each diagnostic is binarized using a fixed threshold of 0.4 to assign a label of HIGH or LOW. These three binary labels are combined to form one of eight distinct TSF regime cells (e.g., TREND×SEASON×FORECAST), ensuring a balanced distribution of difficulty levels across the benchmark.
Experiment
- Comprehensive Benchmark Evaluation: Ten models across deep learning, foundation, and statistical families were tested under 18 task configurations using dense rolling windows. This validates that deep learning models generally outperform foundation models in short-context scenarios, while foundation models excel with long historical context, and confirms that statistical baselines are insufficient for complex traffic forecasting.
- Scaling and Efficiency Analysis: Experiments varying data volume and model size demonstrate that increasing training data yields significantly larger performance gains than increasing model parameters. This validates that task-specific deep learning models are far more parameter-efficient, achieving comparable or superior accuracy to massive foundation models with orders of magnitude fewer parameters.
- Context Length and Horizon Sensitivity: Analysis of context length reveals a functional split where deep learning models are specialists for short histories, whereas foundation models leverage pre-training to exploit long-range dependencies. Forecast horizon tests further show that task-specific architectures maintain stability over long prediction windows better than foundation models, which degrade more rapidly as uncertainty accumulates.
- TSF Regime Specialization: Evaluation across Trend, Seasonality, and Forecastability (TSF) regimes identifies forecastability as the primary driver of difficulty. Results validate that foundation models are more robust in low-forecastability (noisy) environments and high-seasonality regimes, while deep learning models dominate in trend-driven, low-seasonality scenarios.
- Robustness and Generalization: Cross-metric and cross-benchmark comparisons confirm that model rankings are consistent regardless of the error metric (MAE vs. MSE) or the specific dataset provenance. This validates that the observed performance differences reflect intrinsic model capabilities rather than artifacts of specific evaluation settings or data sources.