Command Palette
Search for a command to run...
StreakMind: 天体画像における人工衛星の軌跡のAIによる検出・解析と自動データベース連携
StreakMind: 天体画像における人工衛星の軌跡のAIによる検出・解析と自動データベース連携
Rafael Carrillo René Duffard Pablo García-Martín Javier Romero Nicolás Morales Luis Gonçalves
概要
人工衛星や宇宙デブリは天文画像の汚染を日益に深刻化させており、科学的な調査に支障をきたすだけでなく、多数のストリーク(軌跡)を含む露出画像を生成している。大規模データに対して手動での検出は現実的ではなく、データ品質の管理および地球軌道上の天体のモニタリングのために、ストリークの信頼性の高い検出とその特性評価が不可欠となっている。本研究では、天文画像中の地球近傍天体(NEO)および衛星ストリークを検出し、その幾何学的特性を評価し、既知の軌道天体と相互対照(クロスアイデンティフィケーション)を行うための自動化パイプライン「StreakMind」を紹介する。本システムはすべての推論結果を、大規模調査に適した構造化データベースに統合する。YOLO-OBBモデルは、手動アノテーションされた画像と合成画像から成る2,335枚のハイブリッドデータセットで訓練され、処理済みのFITSフレーム中のストリークを検出するために用いられた。その後、幾何学的最適化、フレーム間連関、衛星とのクロスアイデンティフィケーション、ガウス分布に基づく信頼度スコアリングを適用し、最終的な同定結果を生成した。これらの結果は、正規化されたリレーショナルデータベースに格納された。本研究では、ラ・サグラ天文台(L98)でCelestron C14+Fastar望遠鏡を用いて取得された画像を用いて、自動ストリーク検出および特性評価手法の開発とテストを行った。テストセットにおいて、本モデルは精度94%、再現率97%を達成した。
One-sentence Summary
StreakMind is an automated pipeline employing a YOLO-OBB model trained on a hybrid manual-synthetic dataset of 2335 images to detect and characterise satellite streaks and near-Earth objects in processed FITS frames, applying geometric refinement, inter-frame association, and Gaussian-based confidence scoring to store cross-identified results in a normalised relational database, achieving 94% precision and 97% recall on the test set.
Key Contributions
- This work presents StreakMind, an end-to-end pipeline designed to detect linear streaks in ground-based astronomical images and refine their geometry across consecutive frames. The system standardises measurements into Minor Planet Center (MPC)-style records and cross-identifies candidate artificial objects using external ephemerides, integrating all outputs into a relational database.
- Detection relies on a YOLO-OBB model trained on a hybrid manual-synthetic dataset of 2335 images to identify streaks in processed FITS frames. Subsequent geometric refinement, inter-frame association, and Gaussian-based confidence scoring are applied to produce final identifications.
- Testing utilized images acquired at La Sagra Observatory (L98) with a Celestron C14+Fastar telescope to validate the automated detection methods. Results on the test set demonstrate a precision of 94% and a recall of 97% for the detection model.
Introduction
Modern astronomical surveys generate vast volumes of imagery where artificial satellites and space debris create streaks that obscure scientific targets like near-Earth objects, necessitating automated quality control and space situational awareness. Traditional methods like the Hough transform or manual inspection cannot handle the scale of modern high-cadence imagery, and existing machine learning solutions often lack end-to-end integration for cross-identification and database management. The authors present StreakMind, an end-to-end pipeline utilizing a YOLO-OBB model to detect and characterize linear streaks in astronomical images. This system refines geometric measurements, associates detections across frames, and cross-references findings with external ephemerides before storing standardized records in a relational database.
Dataset
-
Dataset Composition and Sources
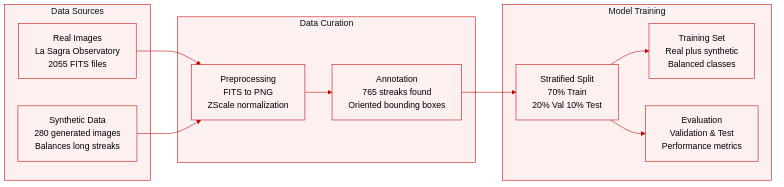
- The authors combine real astronomical observations with synthetically generated data to train the StreakMind pipeline.
- Real images originate from the La Sagra Observatory using a Celestron C14+Fastar reflector and an SBIG ST-10 3 CCD camera.
- The dataset includes 2055 calibrated FITS images captured between April and June 2019 with exposure times ranging from 8 to 120 seconds.
- Synthetic data consists of 280 additional images where linear features were injected into real backgrounds to address class imbalance.
-
Key Details for Each Subset
- Real images measure 1092 by 736 pixels and were manually inspected to identify 765 linear streaks.
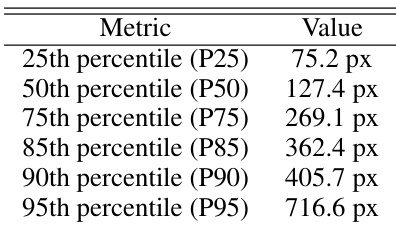
- Streaks are categorized by length using a 269.1 pixel threshold derived from the 75th percentile of the distribution.
- The real subset contains 1523 images without streaks, 412 with short streaks, and 120 with long streaks.
- Synthetic images introduce long streaks exclusively, with 69 percent crossing the full image width and 31 percent remaining within the field of view.
- Orientation for synthetic streaks follows a Gaussian distribution where 70 percent lie between -60 and 60 degrees.
-
Model Training and Data Usage
- The authors adopt a stratified sampling strategy to ensure representative distribution across training, validation, and testing sets.
- The final split allocates 70 percent of images to training, 20 percent to validation, and 10 percent to testing.
- Training sets initially comprised 1438 real images before augmentation improved the representation of long streaks.
- Synthetic data integration balances the frequency of short and long streak classes to mitigate overfitting bias.
-
Processing and Metadata Construction
- FITS files undergo conversion to PNG format using ZScale normalization to enhance contrast while preserving pixel grids.
- A vertical flip is applied to y-coordinates during conversion to align FITS astrometric references with standard raster image conventions.
- Oriented bounding boxes are constructed from streak endpoints with fixed margins to preserve spatial extent and orientation.
- Metadata records include observatory codes, telescope details, astrometric coordinates, and completeness status based on a 40 pixel edge margin threshold.
- Standardized records follow MPC formats to facilitate direct ingestion into detection databases.
Method
The proposed pipeline, StreakMind, employs a deep learning backbone for initial detection followed by a series of geometric and photometric refinement stages. The core detection engine utilizes a pretrained YOLO11 model configured specifically for Oriented Bounding Boxes (OBBs), which was initially trained on the DOTAv1.0 dataset and subsequently fine-tuned on an augmented astronomical dataset. This single-stage detector predicts both the location and category of objects in a single pass, outputting OBBs defined by four corner points.
Refer to the geometric definition below for the parameterization of these detections:
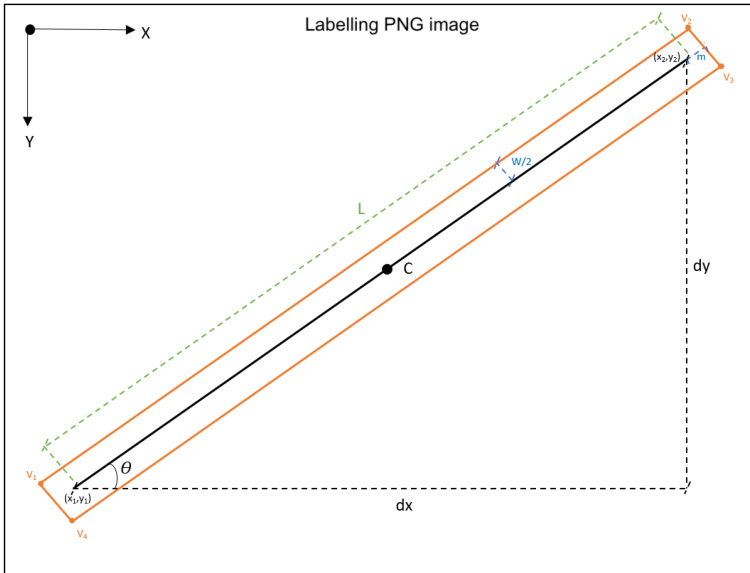
In this representation, each detection is characterized by its center C, major axis length L, width w, and orientation angle θ relative to the image axes, with vertices labeled v1 through v4. Following the initial detection, the pipeline implements a multi-stage refinement process. First, a catalogue-driven filtering stage suppresses false positives caused by stellar diffraction spikes by cross-matching detections with the Gaia DR3 catalogue. Next, a photometric pre-analysis extends the OBBs longitudinally to better capture the true extent of faint streaks that the regressor might underestimate. This is achieved by sampling a flux profile I(s) along the major axis and extending the endpoints until the signal drops below a dynamic threshold defined as I(s)>Ibg+kσ.
Subsequently, the endpoints of the streaks are estimated by clustering the four corner vertices of the refined OBBs into two groups using agglomerative hierarchical clustering. The centroids of these clusters provide stable estimates for the streak endpoints and the center. Finally, the pipeline performs geometric extrapolation and inter-frame association to link detections across consecutive images. This involves calculating pixel velocities based on the displacement of markers over exposure time, defined as v=texpΔm. These velocities are used to project markers forward or backward in time to match candidates in subsequent frames, ensuring that tracks are maintained even if an object is temporarily absent. The processed data is then cross-identified with satellite ephemerides and exported to a structured database.
Experiment
The evaluation combined quantitative analysis on a held-out test set with qualitative visual inspections to validate detection accuracy under both controlled and real astronomical conditions. Comparisons with manual inspection revealed that the automated pipeline offers significant advantages in scalability, sensitivity to faint features, and immediate database integration, although geometric precision requires specific post-processing for very long streaks. Overall, the results confirm the feasibility of an end-to-end detection system that maintains robust performance and supports future expansion to diverse observatories via transfer learning.
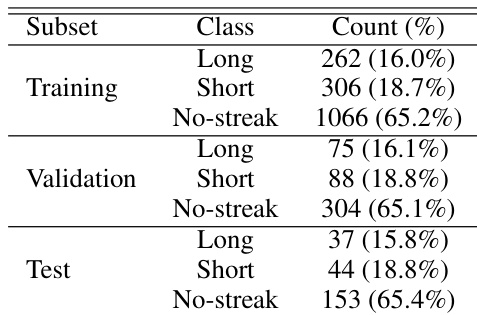
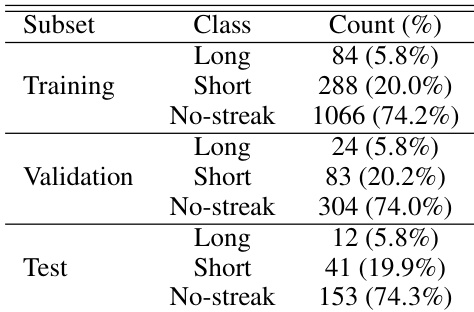
The dataset is organized into training, validation, and test subsets, with samples classified as Long streaks, Short streaks, or No-streak images. The distribution of these classes is remarkably consistent across all three subsets, indicating a representative split. The No-streak category represents the majority of the data, while the streak categories form the minority. The dataset is divided into training, validation, and test subsets with consistent class proportions. The No-streak class is the dominant category across all subsets. Streak instances are split into Long and Short classes with comparable frequencies.
The the the table displays the distribution of streak lengths in pixels across various percentiles, indicating a wide variation in the size of detected objects ranging from short segments to significantly longer features. The authors note that the model maintains robust geometric accuracy for streaks spanning up to approximately half the image width. While detection remains stable for very long streaks, the text indicates that positional precision is slightly reduced in this regime, requiring dedicated photometric post-processing. The model achieves high detection accuracy with precision and recall rates exceeding 90% on the test set. Geometric reconstruction is reliable for moderate streak lengths but requires additional adjustment for very long features. The automated pipeline offers superior scalability and sensitivity compared to traditional manual inspection methods.
The the the table presents the composition of the dataset used for model development, divided into training, validation, and test subsets. Across all subsets, the distribution of classes remains consistent, with images containing no streaks forming the largest group. Short streaks are more common than long streaks, which constitute the smallest category. The dataset is split into training, validation, and test sets with consistent class ratios. Images without streaks form the majority class in every subset. Short streaks are more frequent than long streaks.
The evaluation employs a dataset split into training, validation, and test subsets with consistent class distributions where images without streaks form the majority. Experiments demonstrate that the model achieves high detection accuracy and reliable geometric reconstruction for moderate streak lengths, though positional precision slightly diminishes for very long features requiring subsequent adjustments. Overall, the automated pipeline proves superior in scalability and sensitivity compared to traditional manual inspection methods.