Command Palette
Search for a command to run...
テキスト、コード、ビジョンの整合:テキストから可視化へのマルチ目的強化学習フレームワーク
テキスト、コード、ビジョンの整合:テキストから可視化へのマルチ目的強化学習フレームワーク
Mizanur Rahman Mohammed Saidul Islam Md Tahmid Rahman Laskar Shafiq Joty Enamul Hoque
概要
テキストから可視化(Text-to-Visualization, Text2Vis)システムは、表形式データに対する自然言語クエリを簡潔な回答および実行可能な可視化に変換する。現在、閉鎖型の大規模言語モデル(LLM)は機能的なコードを生成するが、その結果として得られるグラフは意味的整合性や視認性に欠けやすく、これらは実行後にのみ評価可能である。一方、オープンソースモデルはさらに困難に直面し、しばしば実行不可能なコードや視覚的に劣る出力を生成する。従来の教師あり微調整(Supervised Fine-Tuning, SFT)はコードの実行可能性を改善することができるものの、実行後のフィードバックを捉えられない従来のSFT損失関数の限界により、全体的な可視化品質の向上には寄与しない。このギャップを埋めるために、本研究ではText2Vis生成のための最初の強化学習フレームワークであるRL-Text2Visを提案する。本手法は、グループ相対的方策最適化(Group Relative Policy Optimization, GRPO)に基づき、実行後のフィードバックを用いて、テキストの正確性、コードの妥当性、可視化品質の3つの目的を統合的に最適化する新たな多目的報酬関数を採用している。Qwen2.5モデル(7Bおよび14B)を用いた訓練により、RL-Text2VisはText2VisベンチマークにおいてGPT-4oに対して可視化品質で22%の相対的向上を達成し、コード実行成功率をゼロショットベースラインから78%から97%まで向上させた。本モデルは強力なゼロショットおよび教師ありベースラインを大きく上回り、さらにVIS-EvalやNVBenchといったドメイン外データセットに対しても堅牢な汎化性能を示した。これらの結果は、GRPOが可視化生成における構造的・マルチモーダル推論において有効な戦略であることを示している。本研究のコードは、https://github.com/vis-nlp/RL-Text2Vis にて公開している。
One-sentence Summary
The authors, affiliated with York University, Salesforce AI Research, and Nanyang Technological University, propose RL-Text2Vis, a reinforcement learning framework using Group Relative Policy Optimization with a multi-objective reward to jointly optimize textual accuracy, code validity, and visualization quality in text-to-visualization generation. By leveraging post-execution feedback, the method significantly improves chart quality and code execution success over zero-shot and supervised baselines, achieving 22% relative improvement in chart quality and 97% execution success on the Text2Vis benchmark, demonstrating strong generalization to out-of-domain datasets.
Key Contributions
- Text-to-Visualization systems face a critical challenge in generating both executable code and semantically aligned, visually clear charts, as traditional supervised fine-tuning cannot optimize post-execution qualities like chart readability and query alignment.
- The authors introduce RL-Text2Vis, the first reinforcement learning framework for Text2Vis that uses Group Relative Policy Optimization (GRPO) with a novel multi-objective reward to jointly optimize code validity, visualization quality, and textual accuracy based on post-execution feedback.
- Evaluated on the Text2Vis benchmark and out-of-domain datasets like VIS-Eval and NVBench, RL-Text2Vis achieves a 22% relative improvement in chart quality over GPT-4o and increases code execution success from 78% to 97% compared to its zero-shot baseline.
Introduction
Text-to-Visualization (Text2Vis) systems aim to bridge the gap between natural language queries and executable, semantically accurate visualizations of tabular data—critical for enabling non-technical users to derive insights from data. However, prior approaches face key limitations: supervised fine-tuning (SFT) improves code executability but fails to optimize post-execution qualities like visual clarity and query alignment, while closed-source models often produce semantically incorrect charts despite functional code. Open-source models struggle further with both execution reliability and output quality.
The authors introduce RL-Text2Vis, the first reinforcement learning framework for Text2Vis that leverages post-execution feedback to jointly optimize textual accuracy, code validity, and visualization quality. Built on Group Relative Policy Optimization (GRPO), the method uses a novel multi-objective reward derived from LLM and vision-language model evaluations of text, code, and rendered charts. This enables scalable, critic-free training that directly targets multimodal output quality.
By training Qwen2.5 models (7B and 14B), RL-Text2Vis achieves a 22% relative improvement in chart quality over GPT-4o and boosts code execution success from 78% to 97% on the Text2Vis benchmark. It also demonstrates strong generalization to out-of-domain datasets, offering a practical, privacy-preserving alternative to proprietary models.
Dataset

- The dataset comprises chart-generation tasks derived from real user queries, sourced from public web forums, academic datasets, and synthetic query generation using language models.
- It is divided into three subsets:
- Web-Query Subset: 12,000 examples from user questions on data visualization platforms, filtered to include only those with clear intent and available ground-truth data.
- Synthetic Subset: 8,000 examples generated via prompt engineering to cover diverse chart types, complexity levels, and multi-step reasoning.
- Academic Subset: 5,000 examples from published research papers and datasets, selected for high data fidelity and complex analytical tasks.
- The authors use the dataset to train a chart correctness scoring model, with a training split of 80% (12,000 examples), validation at 10% (1,500), and testing at 10% (1,500).
- Mixture ratios during training are set to 50% Web-Query, 30% Synthetic, and 20% Academic to balance real-world diversity with controlled complexity.
- Each chart is processed with a cropping strategy that isolates the visualization area from surrounding text or layout elements, ensuring focus on the chart itself.
- Metadata is constructed to include chart type, number of data series, query complexity level, and presence of missing data, all used as auxiliary inputs to the scoring model.
- The correctness score is assigned on a 0–5 scale based on six criteria: query alignment, data integrity, insight representation, missing data handling, complexity handling, and overall clarity.
Method
The authors introduce RL-Text2Vis, a reinforcement learning framework for text-to-visualization generation that leverages post-execution, multimodal feedback to optimize for visualization quality, which is only observable after rendering. The overall framework operates by taking a natural language query and a tabular dataset as input, and the policy model generates a structured output containing a concise textual answer and a runnable visualization code snippet. This output is then evaluated through a two-stage reward mechanism that ensures structural validity and assesses quality across textual, code, and visual dimensions. The policy is updated using GRPO (Group Relative Policy Optimization), a critic-free method that computes advantages via within-group reward standardization, enabling efficient training without a learned value function.
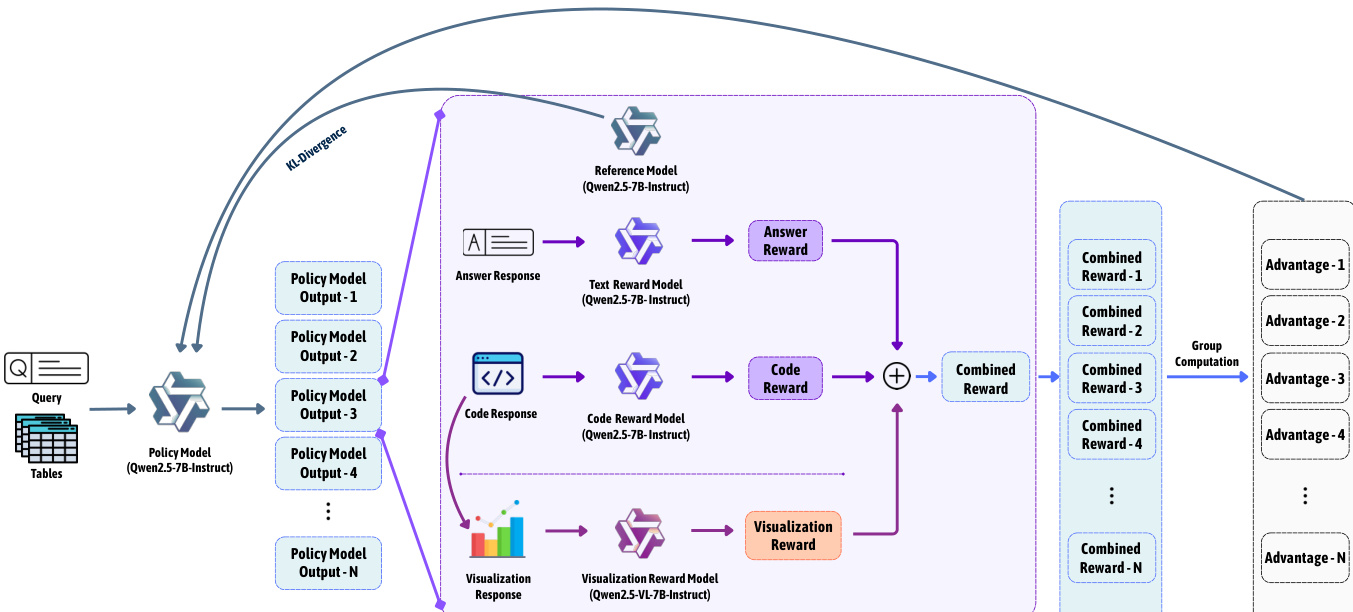
As shown in the figure below, the training process begins with the policy model (Qwen2.5-7B-Instruct) generating multiple candidate outputs for a given query and table. Each output is processed through separate reward models: a text reward model evaluates the answer for semantic alignment with the ground truth, a code reward model assesses code executability and intent match, and a visualization reward model evaluates the rendered chart for readability and correctness. These individual rewards are combined into a composite reward for each output. The rewards are then standardized within the group of generated outputs to compute normalized advantages, which are used in the GRPO objective function. The policy update is performed using a clipped surrogate objective that incorporates a KL divergence penalty to the reference policy (Qwen2.5-7B-Instruct), ensuring stable and bounded updates.
The GRPO optimization objective, as defined in Equation 2, combines PPO-style clipping with a KL regularization term to prevent excessive policy divergence. For each prompt, the policy generates a group of G candidate outputs, and the advantage for each output i is computed as A^i=σrri−rˉ, where ri is the reward, rˉ is the group mean, and σr is the group standard deviation. The importance sampling ratio it(θ) between the current and old policy is clipped within a range defined by ε, and the KL penalty DKL[πθ∣∣πref] is weighted by β to control divergence. This approach eliminates the need for a learned critic, making it scalable to long sequences where value estimation is impractical.
The multi-objective reward design consists of two stages. The first stage, the format reward, enforces structural validity by requiring the output to be a valid JSON object with an answer and a code field; invalid outputs receive a reward of zero and are excluded from optimization. The second stage, the composite reward, integrates three signals: textual correctness (Rtext), code reward (Rcode), and visualization quality (Rvis). The textual correctness score is computed by an LLM-based evaluator, the code reward combines executability and intent match, and the visualization quality is assessed by a VLM. The final composite reward is a weighted sum R=αRtext+βRcode+γRvis, with weights α=0.50, β=0.25, and γ=0.25 selected through grid search to balance performance across all dimensions.
Experiment
- Trained Qwen2.5-7B and Qwen2.5-14B models using GRPO-based RL-Text2Vis framework on Text2Vis benchmark (test1 for training, test2 for evaluation), with multimodal reward judges (Qwen2.5-7B/VL-7B and Qwen2.5-14B/VL-32B) and strong cross-judge agreement (Pearson r = 0.85–0.97).
- Validated framework generality by training Llama-3.1-8B under same setup, achieving comparable results.
- Evaluated on four benchmarks: Text2Vis (in-domain), VisEval, NVBench, and PandasPlotBench (out-of-domain), with GPT-4o as primary evaluator and manual human assessment for robustness.
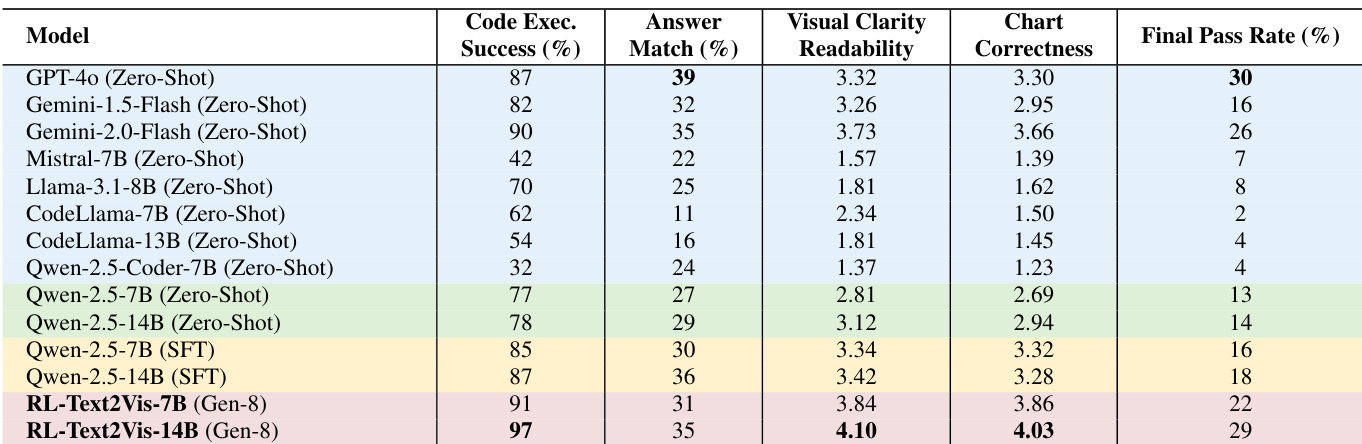
- RL-Text2Vis significantly outperforms zero-shot and SFT baselines on Text2Vis: 14B model achieves 4.10 readability and 4.03 correctness (vs. 3.12 and 2.94 for zero-shot), 97% code executability (vs. 78%), and 35% answer match (vs. 29%); surpasses GPT-4o in chart readability (4.10 vs. 3.32) and correctness (4.03 vs. 3.30).
- Demonstrates strong out-of-domain generalization: on VisEval, 7B model improves readability from 1.50 to 2.50 and correctness from 0.69 to 1.37; on NVBench, code execution rises from 75% to 93%, readability from 2.64 to 3.47, and correctness from 2.34 to 3.28.
- Ablation studies confirm multimodal reward optimization is key; increasing completions per input improves stability and performance.
- Scaling analysis shows consistent gains across Qwen2.5-3B and Llama-3.1-8B, confirming framework’s model-agnostic and scalable nature.
- Human evaluation confirms strong alignment with automated scores (r = 0.88–0.91), validating reported improvements.
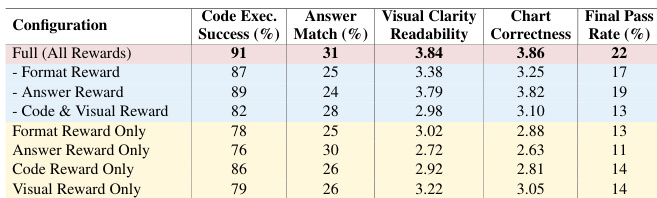
The authors use an ablation study to evaluate the contribution of individual reward components in the RL-Text2Vis framework. Results show that the full multimodal reward, combining code execution, answer matching, and visual quality signals, achieves the highest performance across all metrics, with a final pass rate of 22%, significantly outperforming any single reward component alone.
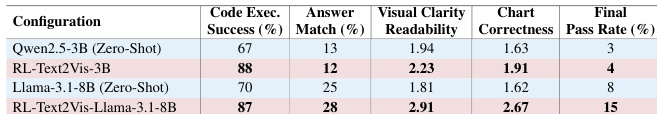
The authors use RL-Text2Vis to fine-tune smaller models, including Qwen2.5-3B and Llama-3.1-8B, on the Text2Vis benchmark. Results show that RL-Text2Vis significantly improves code executability, visual clarity, and chart correctness across both model families, demonstrating the framework's scalability and architecture-agnostic performance.
The authors use the RL-Text2Vis framework to train Qwen2.5-7B and Qwen2.5-14B models on the Text2Vis benchmark, achieving significant improvements over zero-shot and supervised fine-tuned baselines. Results show that RL-Text2Vis-14B outperforms all open-source models and matches or exceeds proprietary models like GPT-4o in key metrics, with a final pass rate of 29% and high scores in visual clarity (4.10) and chart correctness (4.03).
The authors use the RL-Text2Vis framework to train Qwen2.5 models on the Text2Vis benchmark, evaluating their performance on out-of-domain datasets including VIS-Eval, NVBench, and PandasPlotBench. Results show that RL-Text2Vis significantly improves code execution success, visual clarity, and chart correctness across all benchmarks compared to zero-shot and supervised fine-tuned baselines, with the 14B model achieving the highest scores in most categories.

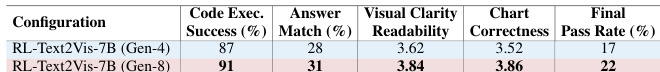
The authors use RL-Text2Vis to train a 7B model, showing that increasing the number of sampled completions from 4 to 8 improves performance across all metrics. The RL-Text2Vis-7B model with 8 completions achieves a 22% final pass rate, outperforming the version with 4 completions (17%), and demonstrates higher code execution success, answer match, visual clarity, and chart correctness.