Command Palette
Search for a command to run...
記憶を超えて:視覚言語モデルにおける人気バイアスを露呈するマルチモーダル順序回帰ベンチマーク
記憶を超えて:視覚言語モデルにおける人気バイアスを露呈するマルチモーダル順序回帰ベンチマーク
Li-Zhong Szu-Tu Ting-Lin Wu Chia-Jui Chang He Syu Yu-Lun Liu
概要
最先端の視覚言語モデル(VLM)には、顕著な「人気バイアス」が存在することが明らかになった。このバイアスにより、有名な建造物に対しては一般の建造物よりも最大で34%高い精度を達成する一方で、それ以外の建造物では著しく性能が低下しており、これは汎化可能な理解ではなく記憶に依存していることを示唆している。この現象を体系的に調査するため、我々は本タスク向けに世界最大級のオープンベンチマークを導入した。それが「YearGuessrデータセット」であり、157か国から収集された55,546枚の建造物画像を含み、構造年(1001年~2024年)の連続順序ラベル、GPS座標、および人気の代理指標としてのページ閲覧数といったマルチモーダル属性を備えている。このデータセットを用いて、建造物の建設年予測タスクを順序回帰(ordinal regression)として定式化し、人気度を考慮した区間精度指標(popularity-aware interval accuracy metrics)を導入して、このバイアスを定量的に評価した。本研究で構築した30以上のモデル(包括的に評価したうちの一つが当研究グループが開発したYearCLIPモデル)を用いたベンチマーク評価により、VLMは人気のある・記憶に残る対象では優れた性能を発揮するが、認知されていない対象に対しては著しく困難を示すことが確認された。これは、VLMの推論能力に重大な欠陥が存在することを示している。プロジェクトページ:https://sytwu.github.io/BeyondMemo/
One-sentence Summary
Researchers from National Yang Ming Chiao Tung University introduce the YearGuessr dataset of 55,000 building images with construction years and popularity metrics, and the YearCLIP model to investigate vision-language model bias through ordinal regression and novel popularity-aware accuracy metrics. Their analysis reveals a 34% accuracy gap favoring famous buildings, exposing VLMs' reliance on memorization rather than generalizable reasoning for architectural understanding.
Key Contributions
- The study identifies a critical popularity bias in vision-language models, where accuracy on famous buildings exceeds that on ordinary structures by up to 34%, revealing over-reliance on memorization rather than generalizable reasoning about architectural subjects.
- To address this, the authors introduce YearGuessr, the largest open benchmark for construction year prediction, featuring 55,546 building images from 157 countries with ordinal year labels (1001–2024), GPS data, and popularity metrics, alongside novel popularity-aware interval accuracy metrics for ordinal regression evaluation.
- Their YearCLIP model employs a coarse-to-fine ordinal regression approach fusing image, GPS, architectural style, and reasoning prompts to predict construction years, with benchmarking across 30+ models confirming VLMs' consistent struggle on less popular buildings despite strong performance on memorized examples.
Introduction
The source text provided is empty. Without research content to analyze, it is impossible to summarize the technical context, prior limitations, or the authors' contribution. Please provide the relevant research excerpt for a substantive summary.
Dataset
The authors introduce YearGuessr, a 55,546-image benchmark for building age estimation, sourced entirely from Wikipedia and Wikimedia Commons under CC BY-SA 4.0 or Public Domain licenses. Key details per subset:
- Composition: Images span 157 countries (63.3% Americas, 22.5% Europe), 1001–2024 CE construction years, with GPS coordinates, textual descriptions (median 2,240 characters), and annual pageview counts (July 2023–2024) as popularity proxies.
- Cleaning: Raw 90k crawl underwent deduplication (−8,346), CLIP filtering for building relevance (−26,338), and light manual test-set audit (−35), retaining only unique facades.
- Splits: Stratified 60/20/20 train/validation/test splits (33,337/11,122/11,087) by decade and continent; no cross-split leakage.
The paper frames construction year prediction as ordinal regression, using pageview counts to expose popularity bias (e.g., VLMs score 34% higher on famous buildings). Training employs the full 33k-image train split with mixture ratios unspecified, while evaluation uses popularity-aware interval metrics across 30+ models.
Processing includes reverse-geocoding GPS to country labels, deriving rural/urban density via GPWv4.11 (<300, 300–1,500, >1,500 people/km²), and annotating renovation status via LLM analysis of descriptions. No image cropping is applied; metadata enrichment focuses on geographic and temporal context for bias analysis.
Method
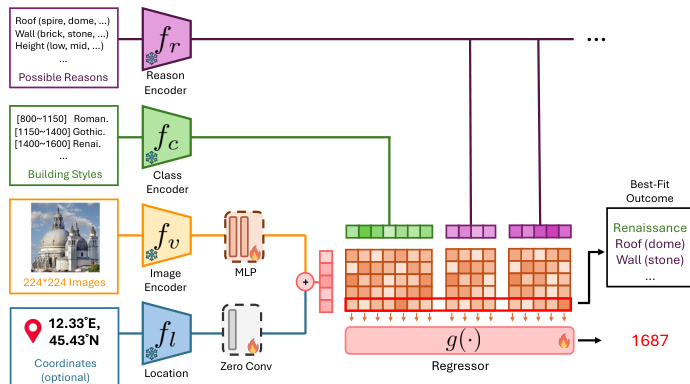
The authors leverage a multi-branch, coarse-to-fine architecture called YearCLIP to predict the construction year of buildings from facade images, optionally augmented with GPS coordinates. The model is designed to not only output a scalar year prediction but also generate a human-readable rationale grounded in architectural features.
The pipeline begins with input processing: a 224×224 pixel image is encoded via a frozen CLIP-based image encoder fv, producing raw visual features zvraw, which are then refined through an MLP into the final image embedding zv. When geographic coordinates are available, they are processed by a location encoder fl—comprising an MLP followed by a learnable ZeroConv—to generate a location embedding zl. These are fused via element-wise addition to form the joint input embedding zinput=zv+zl; if coordinates are absent, zv alone serves as the input.
Parallel to this, the model leverages pre-defined architectural knowledge. A class encoder fc maps seven coarse architectural styles—each associated with a historical period (e.g., Roman: 800–1150, Baroque: 1600–1750)—into fixed embeddings zci. Simultaneously, a reason encoder fr encodes a bank of architectural attributes (e.g., roof types: spire, dome; wall materials: brick, stone) into embeddings zrik.
In the coarse stage, the model computes cosine similarities between the input embedding and each style and reason embedding, yielding similarity scores simci and simrik. These scores are concatenated into a single vector s, which serves as input to a trainable regressor g(⋅). The regressor outputs a probability distribution over the seven historical periods, from which the final year prediction y^ is derived as a weighted average of period midpoints, adjusted by a learnable stability term δi:
y^=i=1∑kpi⋅1+δibiTo generate a rationale, the model evaluates the importance of each reason subcategory by combining its similarity score with the regressor’s attention to the corresponding period. The top five reasons—each represented by its most salient subcategory—are selected to form a natural language explanation.
Refer to the framework diagram, which illustrates the integration of image and location encoders, the parallel encoding of styles and reasons, and the final regressor that synthesizes these signals into a year prediction and rationale.
Experiment
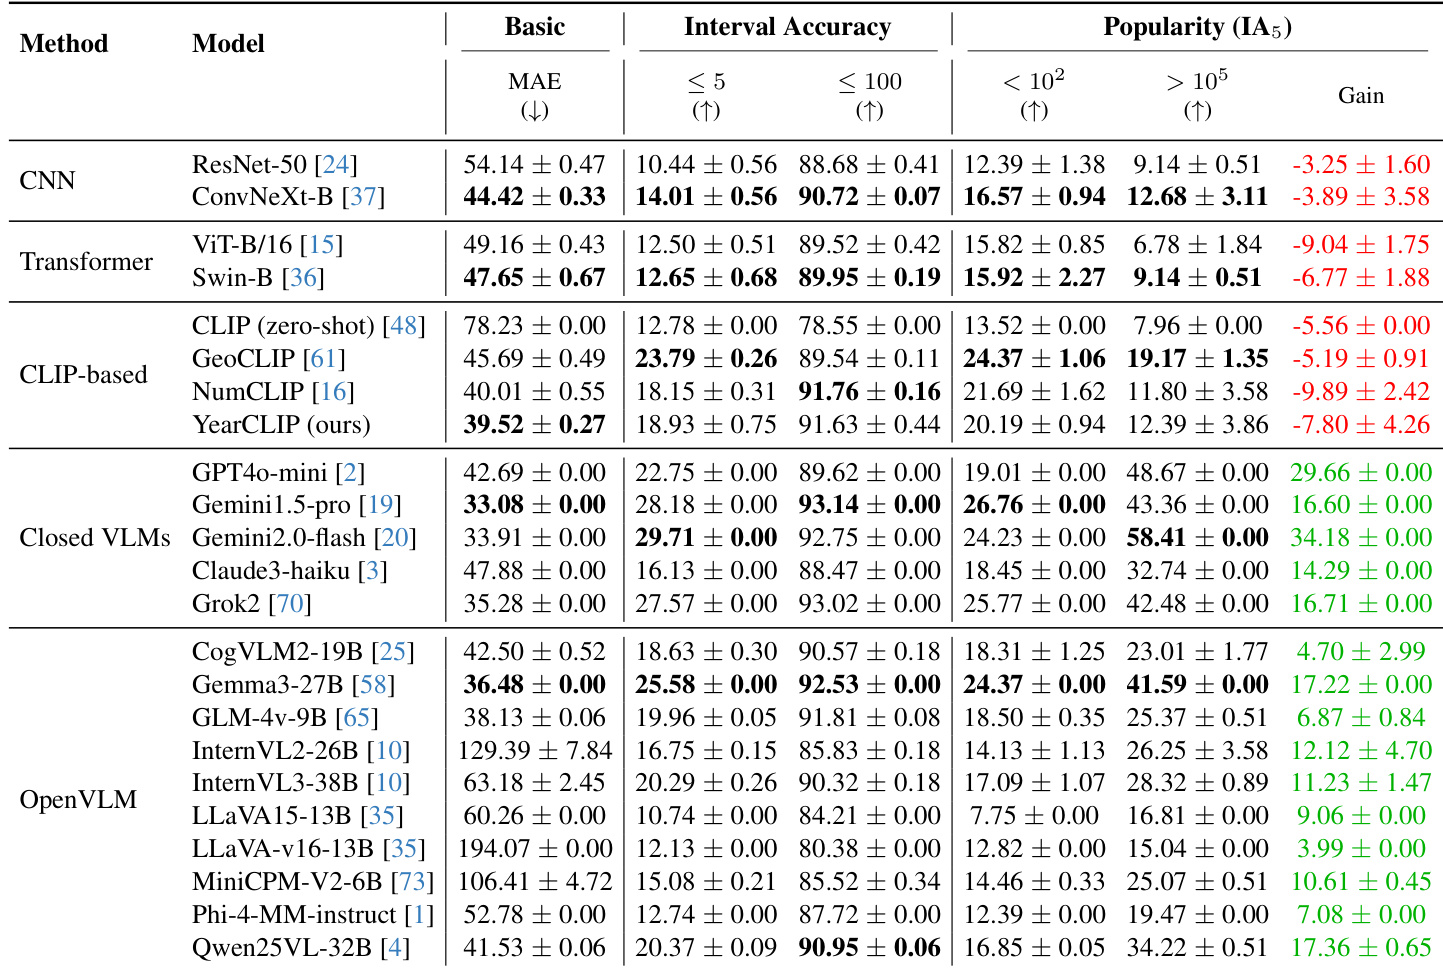
- YearCLIP achieved MAE 39.52 on Year-Guessr test split, reducing error by 13.5% versus GeoCLIP (45.69 → 39.52) and outperforming CNN/Transformer baselines like ConvNeXt-B (44.42 MAE), validating ordinal regression for fine-grained prediction.
- Closed-source VLMs dominated with Gemini1.5-Pro achieving 33.08 MAE, surpassing all open-source models; Gemma3-27B was best open-source at 36.48 MAE.
- Popularity analysis revealed CNN/Transformer models underperformed on iconic landmarks (YearCLIP IA₅ dropped 7.80% for high-popularity buildings), while VLMs like Gemini2.0-Flash showed 34.18% IA₅ gain on popular buildings, indicating memorization bias.
- Geographic bias was evident across models: Gemini2.0-Flash achieved 23.53 MAE in Americas versus 62.73 in Africa; YearCLIP reduced this disparity with Americas MAE 26.10. Temporal bias showed sharp degradation in ancient periods (e.g., 386.86 MAE for 1000-1150 vs. 16.88 for 1900-1950).
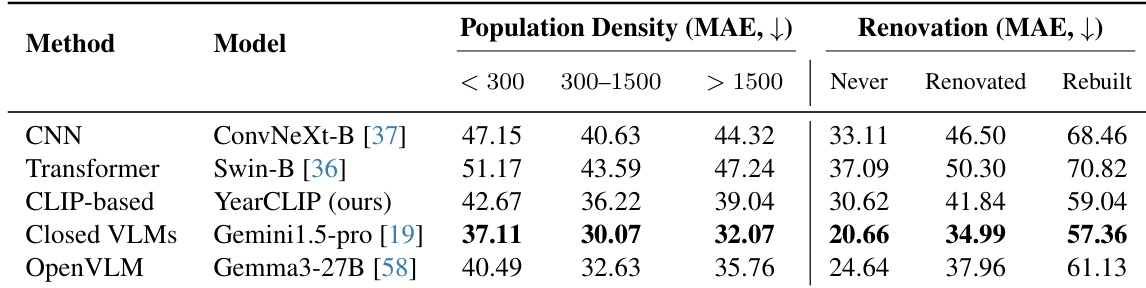
- Renovation status impacted accuracy: Never-renovated buildings had lowest MAE (Gemini1.5-Pro: 20.66), rising to 57.36 for rebuilt structures, while semi-urban areas yielded best density-based results (YearCLIP MAE 36.22).
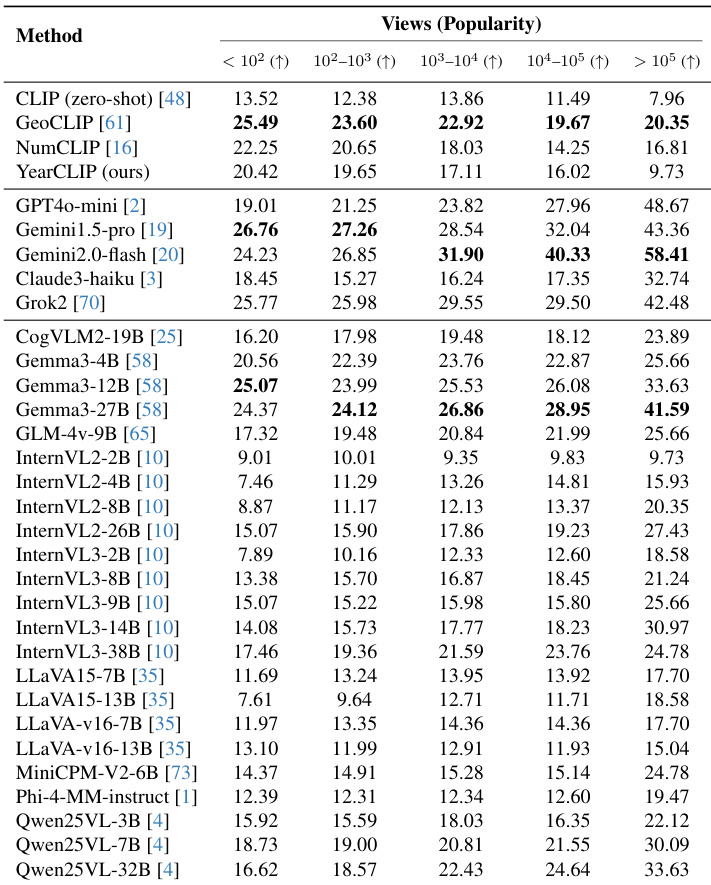
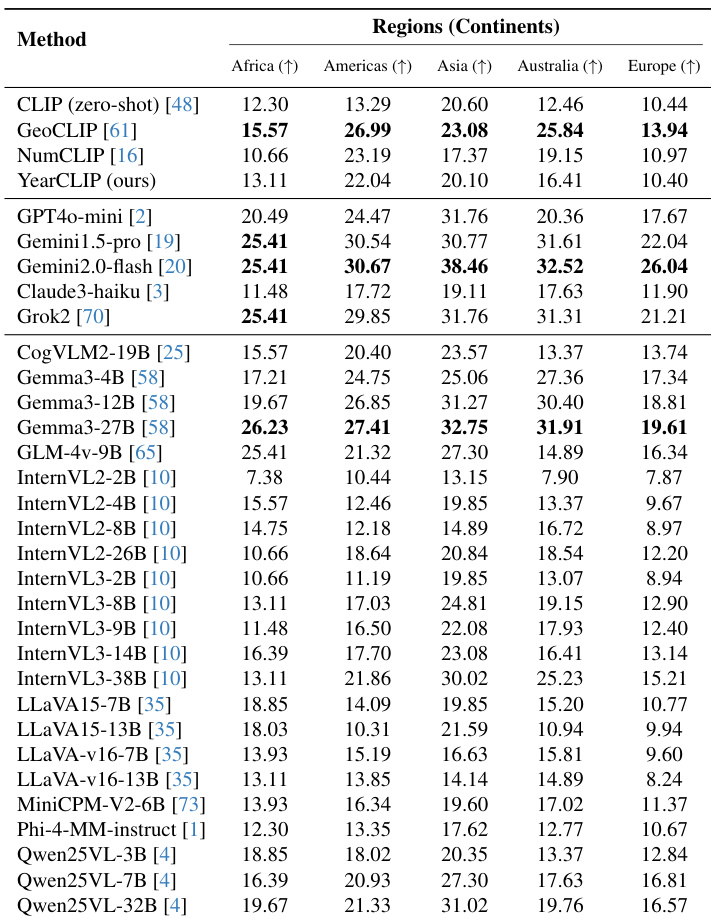
The authors evaluate multiple vision and vision-language models on building age estimation across five popularity bins, revealing that closed-source VLMs like Gemini1.5-Pro and Gemini2.0-Flash show sharply increasing accuracy on highly popular buildings, indicating a strong popularity bias. In contrast, CNN, Transformer, and CLIP-based models exhibit declining accuracy on popular buildings, suggesting they struggle with iconic landmarks due to stylistic complexity rather than relying on memorized associations. YearCLIP, their proposed method, achieves balanced performance across popularity levels while maintaining competitive overall accuracy.
The authors evaluate models across population density and renovation status, finding that semi-urban areas (300–1500 people/km²) yield the lowest MAE for most models, while rural and urban zones are more challenging. Renovated and rebuilt buildings consistently show higher MAE than never-renovated ones, with rebuilt structures being the hardest to date due to loss of original architectural cues. Gemini1.5-Pro achieves the best overall performance across both categories, while YearCLIP outperforms other CLIP-based models and matches or exceeds open-source VLMs in most subgroups.
The authors evaluate model performance across five continents, revealing consistent geographic biases: models achieve the lowest MAE in the Americas and Australia, and the highest in Africa and Europe. YearCLIP and other CLIP-based methods show relatively balanced performance, while many VLMs, including Gemini variants, exhibit pronounced regional disparities, with notably higher errors in Africa and Asia. These patterns reflect training data imbalances, as the dataset is heavily skewed toward the Americas.
The authors evaluate models across geographic regions and historical periods, revealing consistent performance disparities: models achieve lowest MAE in the Americas and Australia, and highest in Africa and Europe, reflecting dataset bias. Temporal analysis shows sharply higher MAE for early periods (e.g., 1000–1150), with all models struggling on ancient architecture, while performance improves markedly for 1900–2024 due to data abundance and stylistic clarity. YearCLIP and Gemini2.0-flash show relatively balanced regional performance, though all models exhibit strong temporal degradation for pre-1600 buildings.
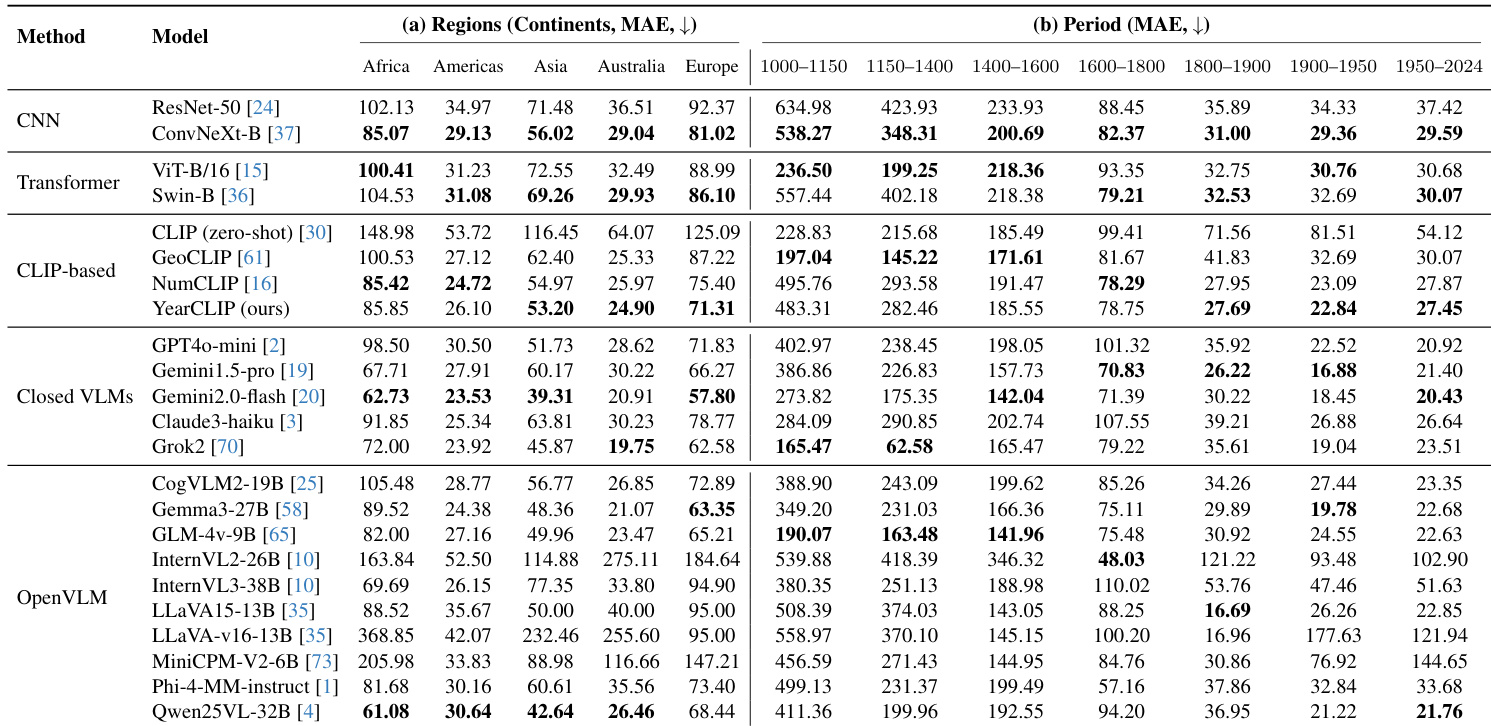
The authors evaluate 23 models on building age estimation, finding that closed-source VLMs like Gemini1.5-Pro (MAE 33.08) and Gemini2.0-Flash (MAE 33.91) achieve the lowest error, while their own YearCLIP (MAE 39.52) outperforms CNN and Transformer baselines and improves over GeoCLIP by 13.5% via ordinal regression. Results show a strong popularity bias in VLMs, with performance gains on high-popularity buildings (e.g., Gemini2.0-Flash Gain +34.18%) likely due to memorized associations rather than architectural reasoning, whereas CNNs and CLIP-based models exhibit declining accuracy on popular landmarks.