Command Palette
Search for a command to run...
DrawEduMath : évaluation de modèles vision-langage à partir d'images mathématiques dessinées à la main par des étudiants, annotées par des experts
DrawEduMath : évaluation de modèles vision-langage à partir d'images mathématiques dessinées à la main par des étudiants, annotées par des experts
Sami Baral Li Lucy Ryan Knight Alice Ng Luca Soldaini Neil T. Heffernan Kyle Lo
Résumé
Dans des contextes réels, les modèles vision-langage (VLM) devraient être capables de traiter de manière robuste un contenu visuel naturaliste et bruité, ainsi que des langages et concepts propres à un domaine. Par exemple, des enseignants du primaire et du secondaire utilisant des plateformes d'apprentissage numérique pourraient devoir examiner de nombreuses images de travaux mathématiques d'élèves et fournir des retours. Pour évaluer le potentiel des VLM à soutenir les enseignants dans de tels contextes, nous introduisons DrawEduMath, un dataset en langue anglaise constitué de 2 030 images de réponses manuscrites d'élèves à des problèmes mathématiques du primaire et du secondaire. Des enseignants ont fourni des annotations détaillées, incluant des descriptions libres de chaque image ainsi que 11 661 paires question-réponse (QA). Ces annotations capturent une richesse d'éclairages pédagogiques, allant des stratégies de résolution de problèmes des élèves à la composition de leurs dessins, diagrammes et écritures. Nous évaluons les VLM sur les paires QA rédigées par les enseignants, ainsi que sur 44 362 paires QA synthétiques dérivées des descriptions des enseignants à l'aide de modèles de langage (LM). Nous montrons que même les VLM à l'état de l'art laissent une grande marge de progression sur les questions de DrawEduMath. Nous constatons également que les paires QA synthétiques, bien qu'imparfaites, peuvent produire des classements de modèles similaires à ceux obtenus avec les paires QA rédigées par les enseignants. Nous publions DrawEduMath afin de soutenir l'évaluation des capacités des VLM à raisonner mathématiquement sur des images recueillies dans des contextes éducatifs.
One-sentence Summary
Researchers from Worcester Polytechnic Institute, UC Berkeley, Allen Institute for AI, and other institutions introduce DrawEduMath, a dataset of 2,030 expert-annotated students' hand-drawn K-12 math images comprising 11,661 teacher-written and 44,362 synthetic QA pairs, revealing that even state-of-the-art vision language models struggle to reason over naturalistic, noisy educational visual content.
Key Contributions
-
DrawEduMath is an English-language benchmark comprising 2,030 images of handwritten K-12 math work, teacher-written image descriptions, 11,661 teacher-authored question-answer pairs, and metadata such as problem type and grade level.
-
A scalable benchmark construction and evaluation approach combines teacher annotations with language-model generation to produce 44,362 synthetic question-answer pairs, and experiments indicate that these pairs can yield model rankings similar to teacher-written pairs.
-
Evaluation of current vision-language models on DrawEduMath shows that leading systems still struggle with questions about the correctness of student solutions, while closed models such as Claude and GPT-4o outperform the open-weight Llama 3.2-11B model.
Introduction
As AI systems improve at mathematical reasoning, there is growing interest in using them for tutoring, instant feedback, and error diagnosis in math education. However, many existing math benchmarks rely on curated or typed problems and do not capture the unstructured, handwritten work produced by real students, nor do they reflect teacher-aligned instructional context such as misconceptions and solution strategies. The authors leverage teacher expertise and a language model pipeline to create DrawEduMath, a 2,030-image benchmark of K-12 math problems paired with handwritten student responses, detailed response descriptions, question-answer pairs, and educational metadata. Their evaluation of vision-language models shows that current systems remain limited in interpreting and assessing real student math work beyond superficial visual cues.
Dataset

-
The authors build DrawEduMath, a dataset of student math work paired with teacher annotations and question-answer examples.
-
Base image subset:
- Source: handwritten responses from U.S. students on the online learning platform ASSISTments, where students received teacher feedback on assigned math work.
- Scale: the original pool contained about 60,000 images across 188 problems, averaging about 300 images per problem. The authors randomly sampled 15 images per problem for annotation.
- Grade coverage and problem source: the 188 problems span Grade 2 through high school and come from three overlapping open educational resources: Eureka Math, Open Up Resources, and Illustrative Math.
- Metadata: images are associated with the originating problem, grade range, problem source, and Common Core State Standards labels that identify the targeted math skills or concepts.
- Cropping and privacy processing: undergraduate research assistants cropped images to retain only the math content and obscured personally identifiable information, such as students’ hands, by adding dark rectangles.
- Filtering: after annotation, images flagged as too blurry or failing a secondary personally identifiable information check were removed, leaving 2,030 usable images.
-
Teacher image-description subset:
- Annotators: three New York City math teachers from the nonprofit Teaching Lab described each image.
- Task: teachers wrote thorough descriptions intended to allow another teacher to recreate the image without viewing it.
- Modalities: descriptions were either typed or recorded and transcribed using OpenAI’s Whisper. The dataset contains similar amounts of typed and recorded descriptions.
- Size: teachers initially annotated 2,376 images, but only 2,030 images paired with descriptions remain after quality and privacy filtering.
- Revision: in a second annotation phase, five additional teachers reviewed the descriptions. Most, over 90 percent, were not edited; when edited, changes were usually small typo corrections.
-
Teacher-written question-answer subset:
- Source: the same 2,030 student-response images, augmented through a second round of teacher annotation.
- Content: teachers wrote questions and answers that they would naturally ask about student work, including problem-level questions, response-specific answers, and two universal questions for each response: what errors the student makes and what strategy the student uses.
- Additional QA: teachers could also add up to two image-specific question-answer pairs beyond the problem-level questions.
- Scale: the dataset contains 11,661 teacher-written question-answer pairs.
- Use in the paper: these pairs support teacher-style evaluation of student work and are used to build a taxonomy of question types.
-
Synthetic question-answer subset:
- Generation source: the authors use Claude-3.5 Sonnet and GPT-4o to transform teacher-written image descriptions into atomic information snippets and then into self-contained question-answer pairs.
- Processing rules: the language models were prompted to avoid open-ended or ambiguous questions and to produce concise answers suitable for reference-based evaluation using lightweight metrics such as string or ngram matching.
- Scale: the pipeline produced 44,362 synthetic question-answer pairs.
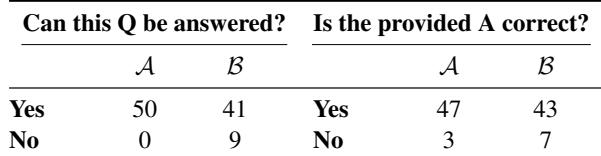
- Quality control: two evaluators reviewed a sample of 100 synthetic pairs, split evenly between the two language models, checking whether each question could be answered from the image and whether the answer was correct. Most sampled pairs were answerable and correct, while errors often came from ambiguous references in the image.
-
Usage and schema:
- The authors use DrawEduMath primarily as an annotated vision-language benchmark and evaluation resource, not as a reported model-training mixture.
- No training split or mixture ratios are described in the provided text.
- The data schema links each student image to its original problem, mathematical metadata, a teacher description, teacher-written QA pairs, and optionally synthetic QA pairs.
- Questions are also organized into a seven-category taxonomy covering higher-level mathematical understanding, low-level visual composition and positioning, writing and labels, problem-solving steps and strategy, counting, image creation and medium, and correctness and errors.
- The taxonomy shows that teacher-written questions focus more on problem-solving steps and correctness, while synthetic questions emphasize different aspects of the images.
Method
The authors structure synthetic QA generation as a multi-stage annotation transformation pipeline rather than asking educators to author all benchmark items directly. Each item begins with a composited visual instance that places a math problem alongside a student response. A teacher first provides a natural language description of the response. A language model then converts that description into atomic facets and question-answer pairs. As shown in the figure below:
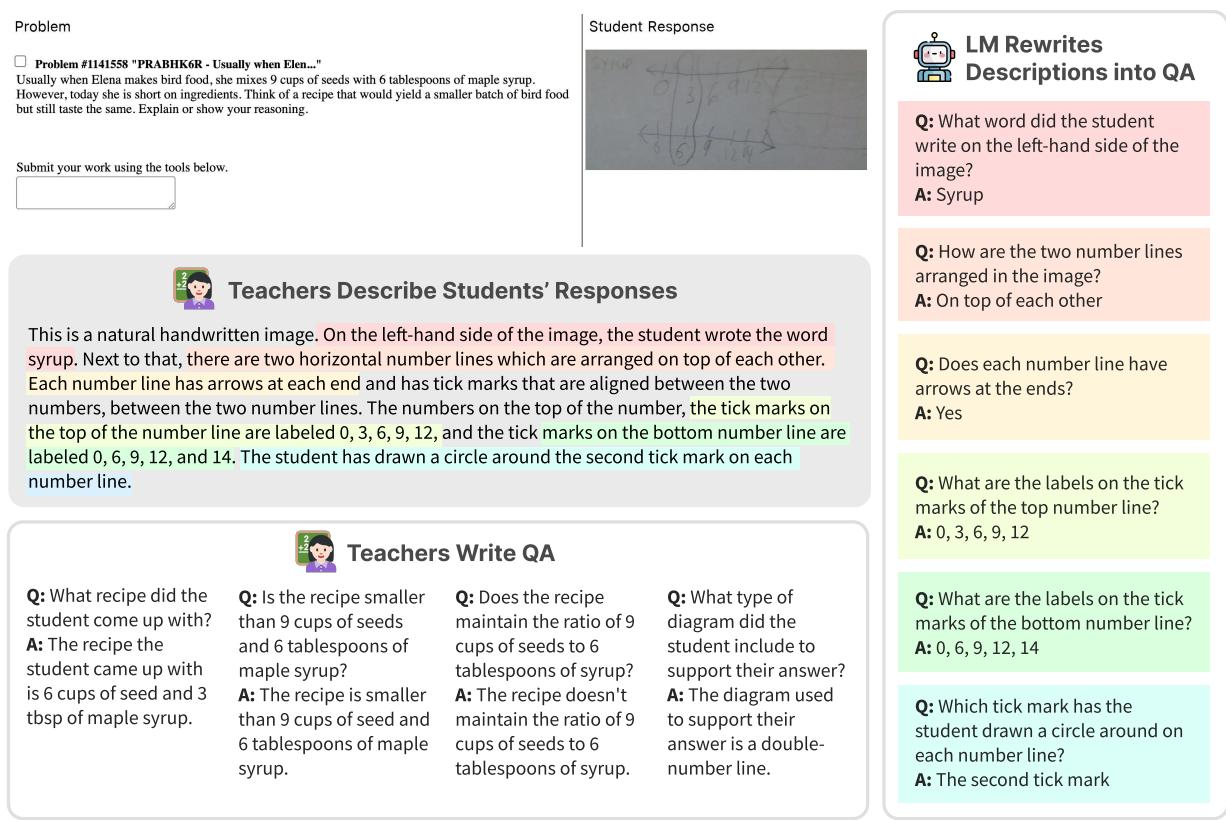
The first module is teacher description. The teacher describes the visual evidence in the student response, including written labels, diagrams, tick marks, arrows, circled elements, and evident problem-solving strategies. This description serves as an intermediate representation that connects the image content to automatically generated QA data.
The second module is language-model-based description-to-QA transformation. The pipeline prompts Claude-3.5 Sonnet and GPT-4o to decompose a teacher description into facets, meaning minimal self-contained units of visual or reasoning information. Formally, for a description d, the system produces facets f1,…,fn and then rewrites each facet into a question-answer pair (qi,ai). The prompts are iteratively refined with expert teacher feedback. The generation instructions emphasize self-contained facets, factual alignment with the image, and concise answers, while avoiding open-ended questions or items with multiple acceptable answers.
This design makes synthetic QA pairs better suited for automatic reference-based evaluation using lightweight metrics such as string matching or n-gram overlap. Teacher-written answers remain valuable because they often contain richer explanatory detail, so the synthetic pipeline is used to scale the benchmark while preserving teacher-authored annotations as a complementary signal.
The third module is quality control. Annotators sample generated QA pairs and evaluate two criteria: whether the question can be answered from the image and whether the answer is correct. This step exposes recurring failure modes. Questions can become unanswerable when references are ambiguous, such as when “the second arrow” is unclear in an image with overlapping arrows. Answers may also be marked incorrect when the underlying question is under-specified or when a source annotation omits a relevant visual detail. The resulting diagnostics guide prompt refinement and help determine which synthetic items are reliable enough to support benchmark construction.
Experiment
The experiments evaluate several vision-language models on handwritten math QA using automatic metrics and human judgments, showing that LM-based scoring aligns best with human assessment. Across teacher-written and synthetic QA sets, model rankings remain broadly consistent, with larger closed models outperforming Llama and questions about error detection proving most difficult. Qualitatively, models struggle with low-quality images and tend to solve math problems instead of interpreting student work, often missing or inventing errors.
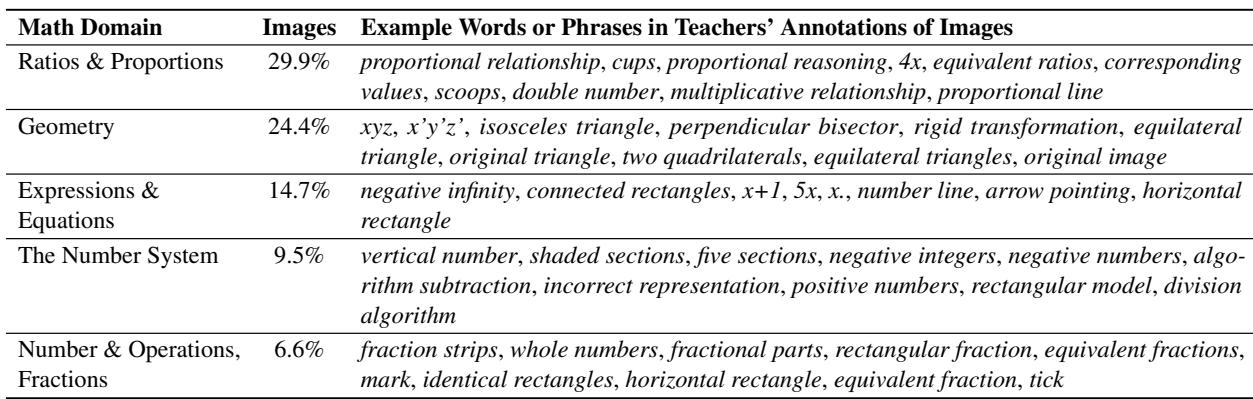
The DrawEduMath annotations cover several foundational K-12 math domains, with Ratios & Proportions and Geometry appearing most often, followed by Expressions & Equations, The Number System, and Number & Operations, Fractions. The example words and phrases show that teachers describe both mathematical concepts and visible features of student work, such as diagrams, number lines, shaded regions, and geometric figures. Ratios and proportions are the most frequent domain, while geometry remains close behind. Teacher annotations pair concept labels with concrete visual cues, including arrows, rectangles, triangles, number lines, and fraction models. The frequent domains span proportional reasoning, algebraic expressions, signed numbers, and fraction equivalence.
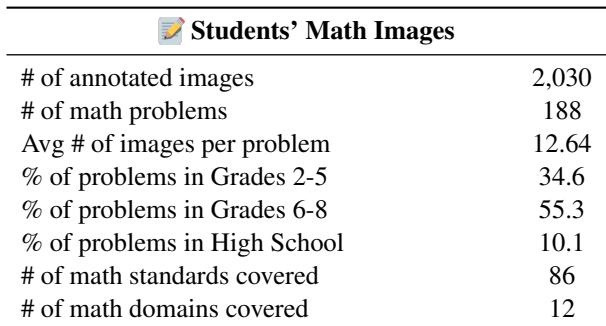
The DrawEduMath dataset contains handwritten math images from U.S. students answering 188 problems across grades 2 through high school. It covers 86 math standards, with most problems aimed at grades 6 to 8 and fewer at high school level. The sampled collection averages about 13 images per problem, reflecting a subset of a larger original pool. The dataset spans a broad K-12 grade range Most problems target middle grade math skills The collection covers 86 distinct math standards
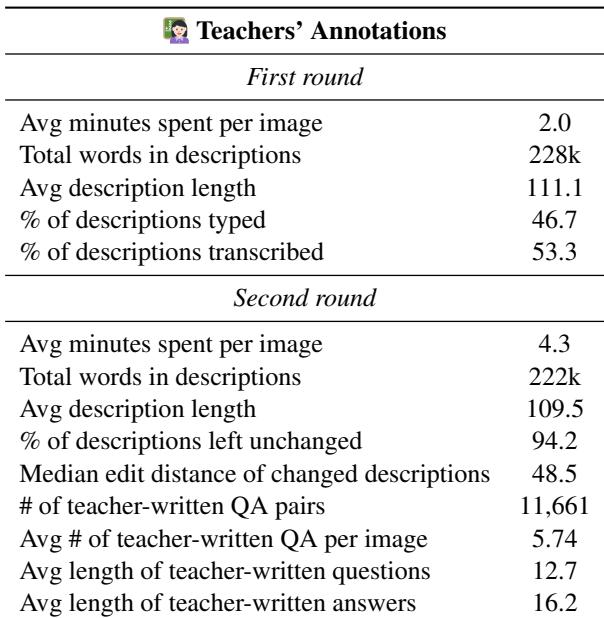
Teacher annotations were detailed, with descriptions averaging over 100 words and a slight majority produced from transcribed speech rather than typed text. The later augmentation stage required substantially more time per example than the initial description stage, but most initial descriptions were left largely unchanged, with revisions typically limited to small corrections. Teacher-written descriptions were relatively long and descriptive. Transcribed annotations made up a slight majority of the first annotation round. The second annotation round was more time-intensive than initial image description. Most initial descriptions were not edited, and when edits occurred they were usually small.
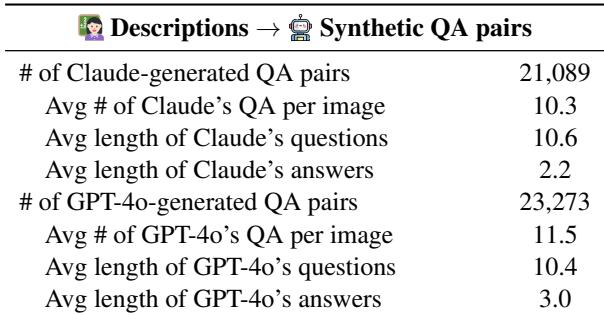
Synthetic question-answer pairs for DrawEduMath were created by transforming teacher descriptions with two language models, producing comparable but uneven volumes. GPT-4o generated slightly more pairs and more pairs per image than Claude, while their questions had similar average lengths. The generated answers were kept short, making them easier for lightweight reference-based scoring, although teacher-written answers remain more informative. GPT-4o contributed a larger share of synthetic QA pairs and more average pairs per image than Claude. Human review sampled generated pairs to check whether the image supports the question and whether the answer is correct.
The annotated results show high but imperfect quality for the sampled generated QA pairs. In one assessed set, all questions were judged answerable and most answers were correct, while the other set had more questions judged unanswerable and slightly fewer correct answers. Most sampled synthetic QA pairs were judged answerable from the provided images Provided answers were generally correct, though not uniformly One set of generated outputs showed higher answerability and correctness than the other
The experiments characterize the DrawEduMath dataset through annotation analyses and evaluations of generated question answer pairs, covering broad K-12 math domains and handwritten student responses. The annotation study shows that teacher descriptions are detailed and combine mathematical concepts with visual cues, while most initial descriptions require only limited revision. The synthetic QA generation study compares two language models and uses human review to assess whether the questions are answerable from the images and whether the answers are correct, finding that many generated pairs are reliable but quality varies across sets.