Command Palette
Search for a command to run...
RealChart2Code: Fortschritte bei der Generierung von Code aus Diagrammen unter Verwendung realer Daten und einer Multi-Task-Evaluation
RealChart2Code: Fortschritte bei der Generierung von Code aus Diagrammen unter Verwendung realer Daten und einer Multi-Task-Evaluation
Zusammenfassung
Vision-Language-Modelle (VLMs) haben in verschiedenen Domänen beeindruckende Fähigkeiten bei der Code-Generierung unter Beweis gestellt. Ihre Fähigkeit, jedoch komplexe, mehrteilige Visualisierungen aus realen Daten nachzubilden, bleibt weitgehend ununtersucht. Um diese Lücke zu schließen, stellen wir exttt{RealChart2Code} vor, einen neuen, groß angelegten Benchmark mit über 2.800 Instanzen, die auf authentischen Datensätzen basieren und Aufgaben mit klarer analytischer Zielsetzung umfassen. Entscheidend ist, dass es sich um den ersten Benchmark handelt, der die Generierung von Diagrammen aus großvolumigen Rohdaten systematisch evaluiert und die iterative Verfeinerung von Code in einem mehrstufigen, konversationellen Setting bewertet. Unsere umfassende Evaluation von 14 führenden VLMs auf RealChart2Code zeigt im Vergleich zu einfacheren Benchmarks eine signifikante Leistungsminderung auf und hebt deren Schwierigkeiten im Umgang mit komplexen Plot-Strukturen und authentischen Daten hervor. Unsere Analyse deckt eine erhebliche Leistungslücke zwischen proprietären Modellen und Modellen mit offenen Gewichten auf und bestätigt, dass selbst State-of-the-Art-VLMs häufig versagen, komplexe, mehrteilige Diagramme präzise nachzubilden. Diese Erkenntnisse liefern wertvolle Einblicke in die aktuellen Grenzen von VLMs und leiten zukünftige Forschungsrichtungen. Den Benchmark sowie den Code veröffentlichen wir unter https://github.com/Speakn0w/RealChart2Code.
One-sentence Summary
Researchers from USTC, THU, CUHK, UCAS, CASIA, and other institutions introduce RealChart2Code, a large-scale benchmark evaluating Vision-Language Models on generating code for complex, multi-panel charts from authentic data. This work uniquely assesses iterative refinement in conversational settings, revealing significant performance gaps between proprietary and open-weight models.
Key Contributions
- The paper introduces RealChart2Code, a large-scale benchmark containing over 2,800 instances grounded in authentic datasets to systematically evaluate chart generation from raw data and iterative code refinement in multi-turn conversations.
- A comprehensive evaluation of 14 leading Vision-Language Models on this benchmark reveals significant performance degradation compared to simpler benchmarks, highlighting specific struggles with complex plot structures and authentic data.
- The analysis uncovers a substantial performance gap between proprietary and open-weight models, confirming that even state-of-the-art systems often fail to accurately replicate intricate, multi-panel charts.
Introduction
Vision-Language Models (VLMs) are increasingly used to generate code for data visualizations, a capability that allows users to recover and edit logic from static images. However, existing benchmarks rely on synthetic data or simple single-panel charts, failing to assess how well models handle complex multi-panel layouts derived from authentic, large-scale datasets. To address this gap, the authors introduce RealChart2Code, a large-scale benchmark featuring over 2,800 instances grounded in real-world data that evaluates both initial code generation and iterative refinement in a conversational setting. Their evaluation of 14 leading VLMs reveals that while models excel at simple tasks, they struggle significantly with intricate structures and real data, exposing a substantial performance gap between proprietary and open-weight systems.
Dataset
RealChart2Code Dataset Overview
The authors introduce RealChart2Code, a benchmark designed to evaluate Vision Language Models on complex, real-world chart-to-code generation tasks. The dataset moves beyond simple synthetic plots to challenge models with intricate multi-panel layouts and high information density derived from authentic data sources.
-
Dataset Composition and Sources
- The foundation consists of open-source datasets collected from Kaggle, strictly adhering to scientific research licensing.
- The curation process began with over 8,000 candidate datasets containing more than 100,000 files and 30 billion data rows.
- A two-stage filtering pipeline reduced this pool to 1,036 high-quality datasets, resulting in a final collection of 3,271 raw data files with approximately 860 million rows.
- The data spans eight high-level domains including Finance, Health, Research, and Technology, covering 35 fine-grained sub-topics.
-
Key Details for Each Subset
- Chart Replication (1,016 instances): The model receives only the chart image and must generate code to replicate it without access to the underlying data.
- Chart Reproduction (1,016 instances): The model is provided with both the chart image and the corresponding raw CSV data files to generate the code.
- Chart Refinement (864 instances): This subset involves a multi-turn dialogue where the model must debug and modify code to fix errors in a "flawed" chart based on user feedback.
- The benchmark includes 50 distinct chart types and 7 high-level visualization intents, ensuring a mix of common plots (e.g., bar charts) and specialized techniques (e.g., Sankey diagrams).
-
Data Usage and Processing
- The authors constructed 1,016 unique visualization scenarios from the curated datasets, which serve as the basis for the Replication and Reproduction tasks.
- Ground-truth code was manually implemented by a team of five expert Python developers using Matplotlib, pandas, and NumPy to ensure high-quality, idiomatic, and executable solutions.
- For the Refinement subset, the authors manually injected diverse errors into the ground-truth code, including visual styling issues, data mapping mistakes, and incorrect chart types.
- The dataset is used to evaluate models on their ability to perceive visual details, interpret data, and perform iterative code editing.
-
Cropping, Metadata, and Quality Control
- No specific image cropping strategy is mentioned; the focus is on preserving the full complexity of multi-panel layouts and composite charts.
- Metadata construction involves strict adherence to data schemas, ensuring that column names, data types, and file paths in the prompts match the provided CSV files exactly.
- A rigorous multi-stage quality control protocol was applied, including automated execution checks in a sandbox environment and visual fidelity reviews by independent experts.
- For refinement tasks, a triple-verification strategy ensured that injected errors were clearly visible in the rendered images and that the correction instructions were logically solvable.
Method
The authors define the chart-to-code task as a conditional code generation problem. Formally, given a source chart image V and an accompanying prompt P, a Large Language Model (LLM), denoted by F(⋅), must generate an executable code snippet C. This code must render a visualization that accurately reproduces the visual and structural elements of V while adhering to any requirements in P. The task is formulated as C=F(V,P).
The framework evaluates models on three distinct variants of this core task, as illustrated in the figure below.
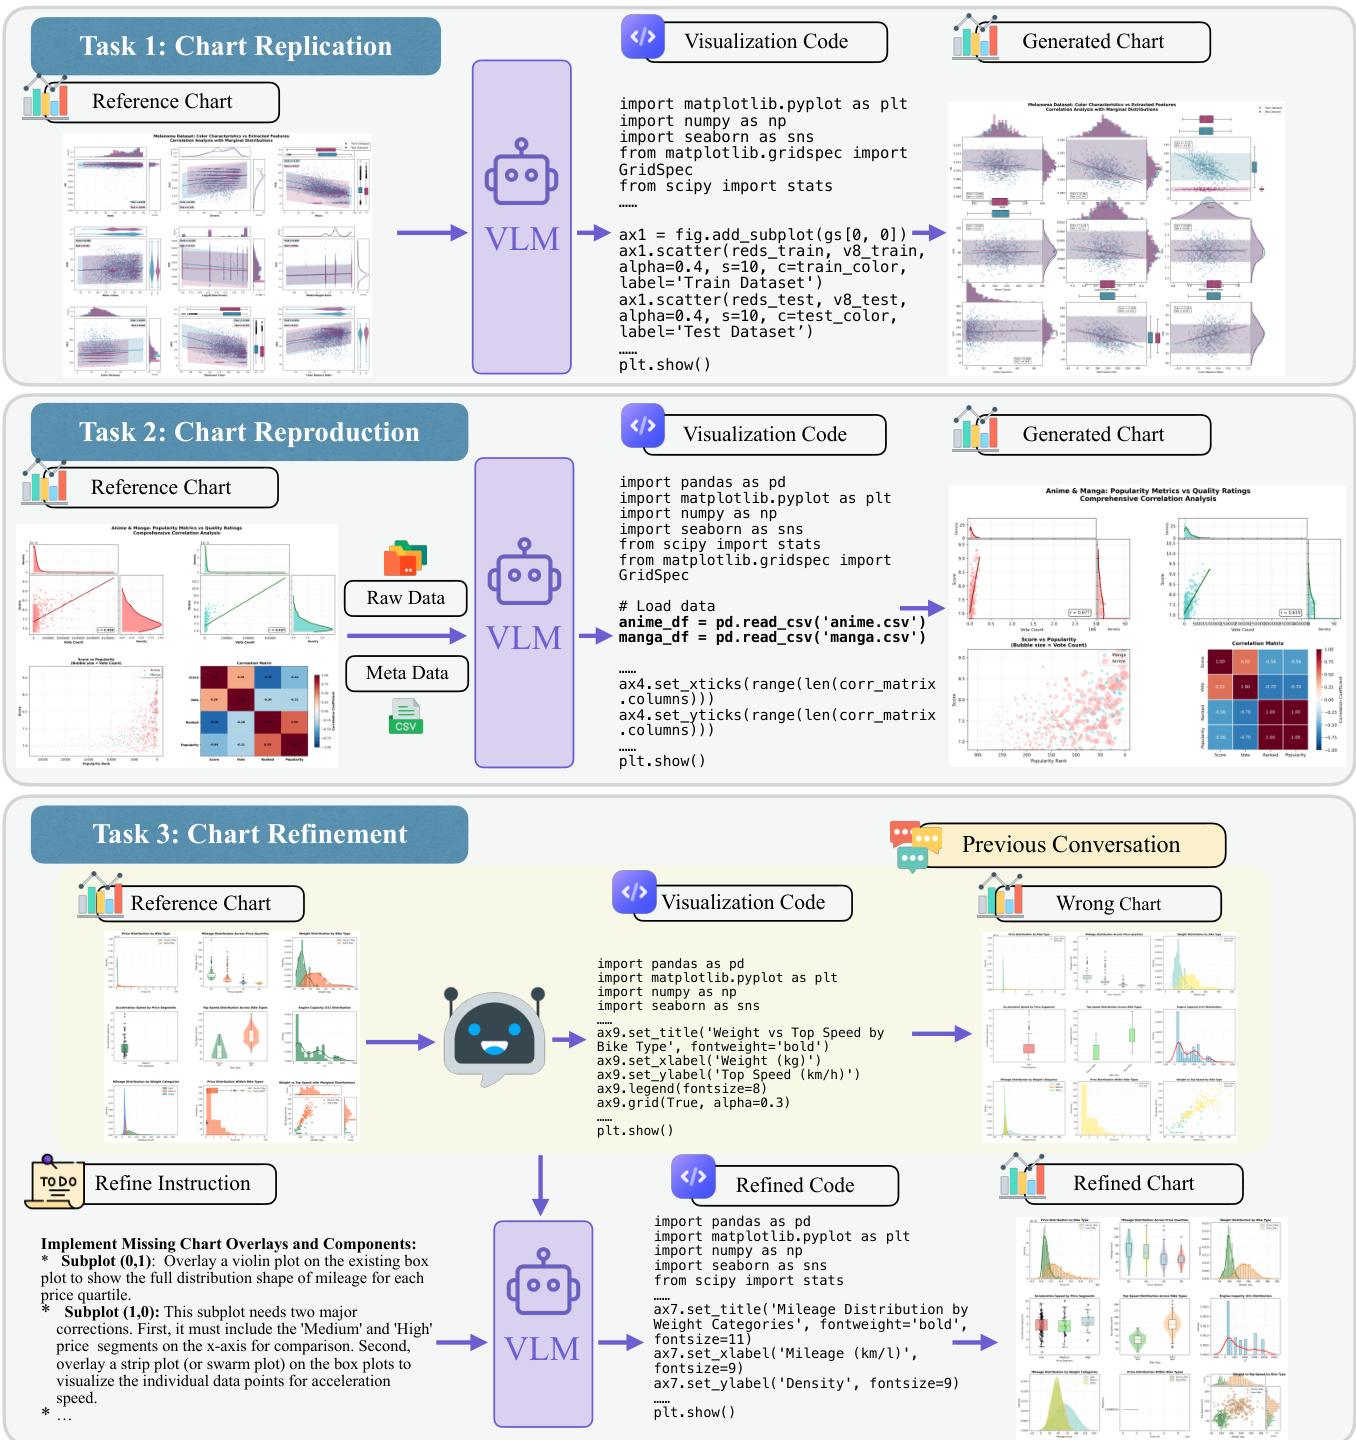
The first variant, Chart Replication, represents the fundamental chart-to-code task where the model must reverse-engineer the visualization from the image alone. This setup measures the core visual-to-code translation ability without external data support. The second variant, Chart Reproduction, provides the model with the chart image, raw data, and metadata. This assesses the capability to generate the correct plot using large-scale, real-world data sources. For this task, the Data Pattern Consistency metric is replaced with Data Alignment, which performs code-level verification to ensure computational correctness rather than visual similarity.
The third variant, Chart Refinement, requires the model to correct a chart with predefined errors through a multi-turn dialogue. This assesses the ability to perform iterative debugging based on user instructions. The process involves analyzing the chart image, interpreting specific refinement instructions, and generating corrected code to produce a refined chart. The model must identify the chart structure, understand the current state including errors, and apply corrections precisely as instructed while maintaining all other visual properties.
Experiment
- Evaluation of 14 LLMs on the RealChart2Code benchmark validates that while proprietary models like Claude-4.5-Opus lead in performance, a significant capability gap exists compared to open-source models on complex, real-world visualization tasks.
- Cross-benchmark analysis demonstrates that high scores on simpler existing benchmarks do not guarantee success on RealChart2Code, revealing a "Complexity Gap" where model performance drops drastically when facing authentic data-driven scenarios.
- Reliability testing confirms that the proposed multi-agent judging framework achieves high consistency and strong alignment with human expert evaluations, ensuring robust and discriminatory assessment of visual quality.
- Error analysis identifies distinct failure patterns where open-weight models frequently suffer from syntax hallucinations and spatial reasoning deficits, whereas proprietary models primarily struggle with data mapping accuracy and maintaining global consistency during iterative refinement.
- Case studies highlight systematic weaknesses in handling hierarchical layouts, composite chart structures, and global canvas scaling, indicating that current models lack the advanced spatial planning and semantic grouping required for professional-grade visualization generation.