Command Palette
Search for a command to run...
PaperBanana: Automatisierung akademischer Illustrationen für KI-Wissenschaftler
PaperBanana: Automatisierung akademischer Illustrationen für KI-Wissenschaftler
Dawei Zhu Rui Meng Yale Song Xiyu Wei Sujian Li Tomas Pfister Jinsung Yoon
Zusammenfassung
Trotz der rasanten Fortschritte bei autonomen KI-Wissenschaftlern, die auf Sprachmodellen basieren, bleibt die Erstellung von publikationsfähigen Abbildungen ein arbeitsintensiver Engpass im Forschungsprozess. Um diesen Herausforderung zu bewältigen, stellen wir PaperBanana vor – einen agentenbasierten Rahmen für die automatisierte Erstellung publikationsfähiger akademischer Abbildungen. Auf Basis modernster VLMs (Vision-Language-Modelle) und Bildgenerationsmodelle koordiniert PaperBanana spezialisierte Agenten, die Referenzen abrufen, Inhalt und Stil planen, Bilder rendern und iterativ durch Selbstkritik verfeinern. Zur rigorosen Evaluation unseres Ansatzes führen wir PaperBananaBench ein, eine Testbench mit 292 Testfällen für Methodik-Diagramme, die aus Publikationen der NeurIPS 2025 stammen und eine Vielzahl von Forschungsfeldern sowie Illustrationsstile abdecken. Umfassende Experimente zeigen, dass PaperBanana konsistent gegenüber führenden Baselines in Bezug auf Treue zum Original, Kürze, Lesbarkeit und Ästhetik übertrifft. Zudem demonstrieren wir, dass unsere Methode effektiv auch auf die Erstellung hochwertiger statistischer Diagramme erweitert werden kann. Zusammenfassend eröffnet PaperBanana neue Wege für die automatisierte Erstellung publikationsfähiger Abbildungen.
One-sentence Summary
Researchers from Peking University and Google Cloud AI Research introduce PAPERBANANA, an agentic framework that automates publication-ready academic illustrations by orchestrating specialized VLM-powered agents for retrieval, planning, styling, and iterative refinement, significantly outperforming baselines in faithfulness, conciseness, readability, and aesthetics across methodology diagrams and statistical plots.
Key Contributions
- PAPERBANANA introduces an agentic framework that automates publication-ready academic illustrations by coordinating specialized agents for reference retrieval, content planning, image rendering, and self-critique refinement using state-of-the-art VLMs and image generators.
- The framework is evaluated on PAPERBANANA BENCH, a new benchmark of 292 methodology diagram test cases from NeurIPS 2025, scored across faithfulness, conciseness, readability, and aesthetics using VLM-as-a-Judge against human references.
- Experiments show PAPERBANANA outperforms baselines by up to 37.2% in conciseness and 17.0% overall, while also extending effectively to statistical plots, demonstrating broad applicability for automating scientific visualization.
Introduction
The authors leverage advances in vision-language models and image generation to tackle the bottleneck of creating publication-ready academic illustrations, which remain labor-intensive despite progress in autonomous AI scientists. Prior methods either rely on code-based tools like TikZ—limited in expressiveness for modern design elements—or generic image generators that struggle with scholarly standards. PAPERBANANA introduces an agentic framework that orchestrates specialized agents to retrieve references, plan content and style, render images, and self-critique, enabling high-fidelity methodology diagrams and statistical plots. It also introduces PAPERBANANA BENCH, a 292-case benchmark from NeurIPS 2025, and outperforms baselines across faithfulness, conciseness, readability, and aesthetics.
Dataset
-
The authors use PAPERBANANABENCH, a benchmark built from NeurIPS 2025 methodology diagrams, to evaluate automated diagram generation. It captures diverse, aesthetically sophisticated diagrams found in modern AI papers.
-
For methodology diagrams:
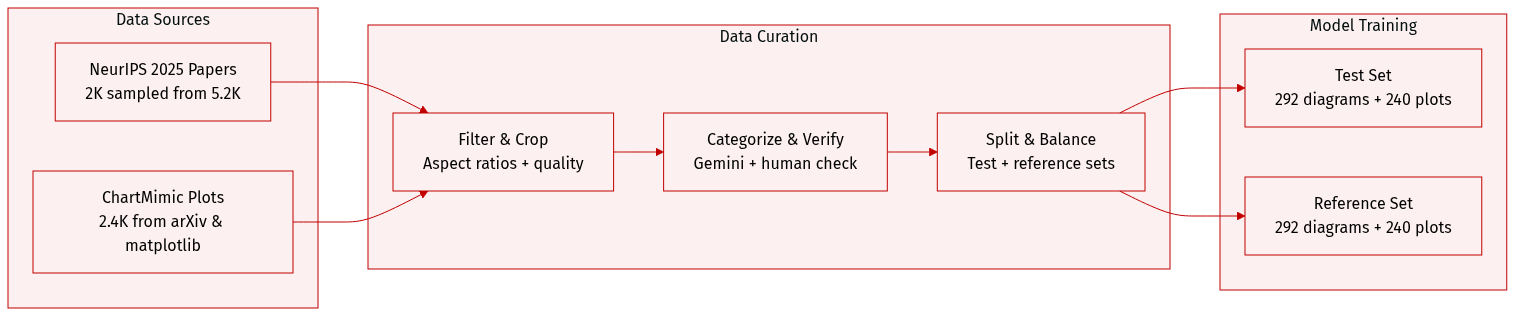
- Start with 2,000 randomly sampled papers from 5,275 NeurIPS 2025 publications; extract methodology text, diagrams, and captions via MinerU.
- Filter to 1,359 papers containing methodology diagrams, then further restrict to 610 by enforcing aspect ratios between 1.5 and 2.5 to match layout norms and model support.
- Each sample is a tuple (S, I, C): methodology text, diagram image, and caption.
- Diagrams are categorized into four classes (Agent & Reasoning, Vision & Perception, Generative & Learning, Science & Applications) using Gemini-3-Pro, with human verification for accuracy and visual quality.
- After human curation, 584 high-quality samples remain, split evenly into test and reference sets (292 each).
-
For statistical plots:
- Repurpose the “direct mimic” subset of ChartMimic (2,400 plots from arXiv and matplotlib), extracting raw data and visual intent via Gemini-3-Pro.
- Filter to 914 plots by excluding randomly generated or geometrically constructed data, and enforcing aspect ratios between 1.0 and 2.5.
- Consolidate 22 original categories into 7 common types: Bar, Line, Tree & Pie, Scatter, Heatmap, Radar, and Miscellaneous.
- Sample 480 plots (80 per category, 40 for Heatmap/Radar), oversampling difficult cases; split evenly into test and reference sets.
-
Processing includes:
- Cropping and aspect ratio enforcement to align with generation model capabilities.
- Metadata construction: each diagram or plot includes visual intent, raw data (for plots), and structured context (methodology text or caption).
- Human curation ensures correctness of text, categorization, and visual quality.
-
The model uses these datasets for evaluation only; no training occurs on PAPERBANANABENCH or the statistical plot testset. Reference sets support retrieval-augmented in-context learning during inference.
Method
The authors leverage PAPERBANANA, a reference-driven agentic framework, to automate the generation of academic illustrations by decomposing the task into a structured, multi-agent pipeline. The core objective is to map a source context S and communicative intent C into a high-fidelity visual output I, optionally guided by a set of reference examples E={En}n=1N, where each En=(Sn,Cn,In). This formulation enables both zero-shot generation (E=∅) and few-shot adaptation, with a primary focus on methodology diagrams that require precise interpretation of technical logic into visually coherent structures.
The framework operates in two principal stages: a Linear Planning Phase and an Iterative Refinement Loop. As shown in the figure below, the Linear Planning Phase orchestrates the initial synthesis of a detailed, stylistically grounded textual description, while the Iterative Refinement Loop transforms this description into a final illustration through multiple cycles of generation and critique.
In the Linear Planning Phase, the Retriever Agent first identifies N relevant examples E from a fixed reference set R by performing a generative retrieval over candidate metadata (Si,Ci) using a vision-language model (VLM). The selection prioritizes visual structure over topic similarity, matching both research domain and diagram type to provide a concrete foundation for downstream agents. The Planner Agent then synthesizes an initial textual description P by performing in-context learning from the retrieved examples, translating the source context S and intent C into a comprehensive, structured blueprint of the target illustration. The Stylist Agent refines this description into a stylistically optimized version P∗ by applying an automatically synthesized Aesthetic Guideline G, which encapsulates domain-specific design principles for color, shape, typography, and layout derived from top-tier conference papers.
The Iterative Refinement Loop begins with the Visualizer Agent, which renders the optimized description P∗ into an initial image I0 using an image generation model. In each subsequent iteration t, the Critic Agent evaluates the generated image It against the original source context (S,C) and the current description Pt, identifying factual misalignments, visual artifacts, or structural ambiguities. It then produces a refined description Pt+1 that addresses these issues, which is fed back to the Visualizer for regeneration. This closed-loop process iterates for T=3 rounds, with the final output being I=IT. The Critic also maintains a factual verification link to the original inputs to ensure semantic fidelity throughout refinement.
For statistical plot generation, the framework adapts the Visualizer and Critic agents to prioritize numerical precision. Instead of direct image generation, the Visualizer converts the description Pt into executable Python Matplotlib code, which is rendered into a plot It. The Critic then evaluates the plot and generates a refined description Pt+1 to correct inaccuracies, maintaining the same T=3 round refinement protocol. This code-based approach ensures rigorous alignment with underlying data while preserving the iterative quality control mechanism.
Experiment
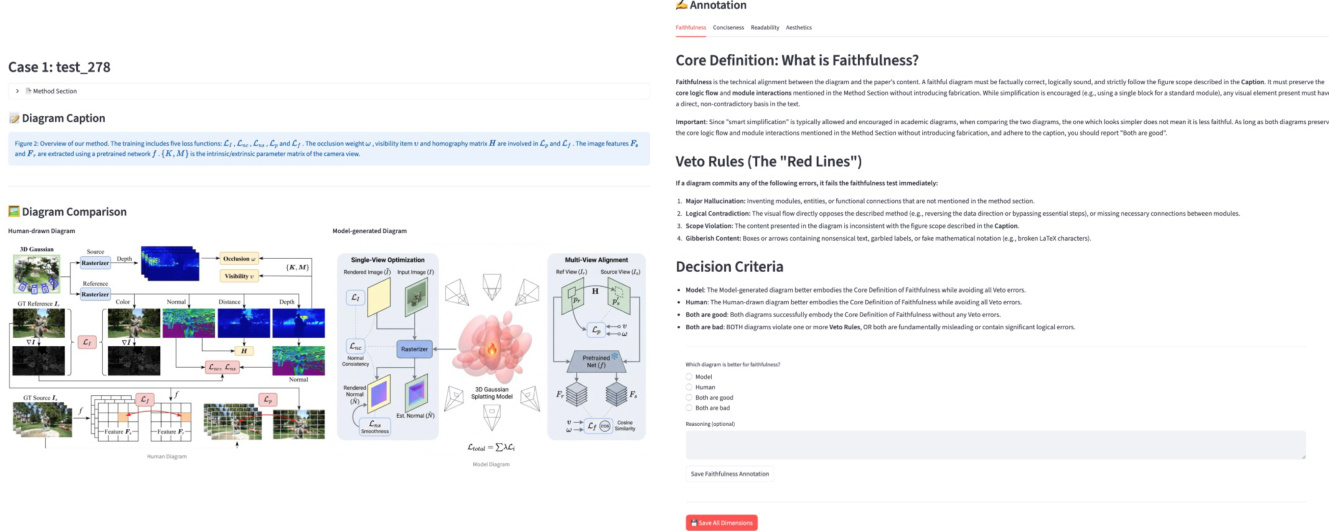
- Evaluated methodology diagrams and statistical plots using VLM-as-a-Judge, comparing model outputs against human-drawn references across faithfulness, conciseness, readability, and aesthetics, with hierarchical scoring prioritizing content fidelity and clarity.
- Validated the VLM judge (Gemini-3-Pro) through strong inter-model agreement and human alignment, confirming its reliability as a proxy for human evaluation.
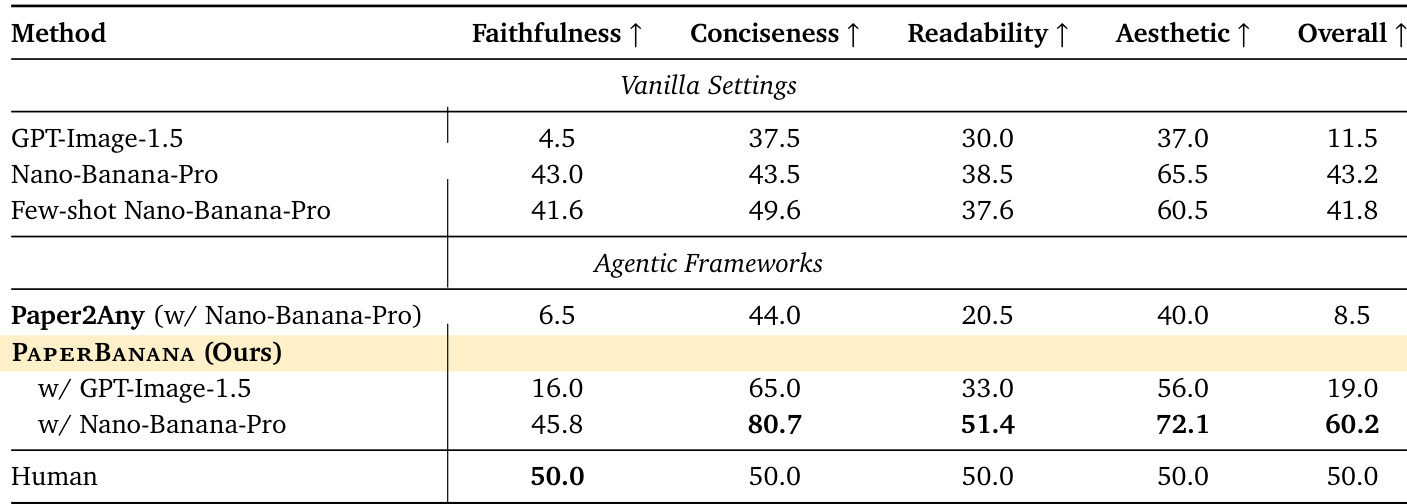
- Demonstrated that PAPERBANANA outperforms baselines including vanilla prompting, few-shot prompting, and Paper2Any, particularly improving faithfulness, conciseness, and readability, with human blind tests confirming its superiority in 72.7% of cases.
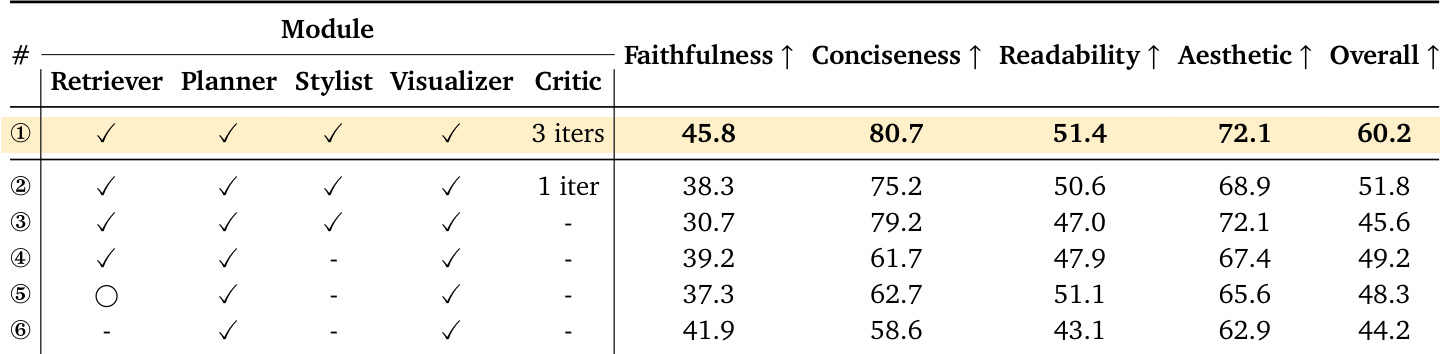
- Ablation studies revealed that retriever agents improve conciseness and aesthetics, while critic agents recover faithfulness lost during stylistic refinement, highlighting the value of iterative agent collaboration.
- Showed that auto-summarized aesthetic guidelines can enhance human-drawn diagrams, with 56.2% of refined outputs rated better in aesthetics than originals.
- Compared code-based and image-generation approaches for statistical plots, finding image models superior in presentation but weaker in content fidelity, suggesting a hybrid approach for optimal results.
- Identified key failure modes in PAPERBANANA, primarily connection errors, which stem from foundation model limitations and are not reliably caught by the critic agent.
The authors use an ablation study to evaluate how each component of their agent-based system contributes to diagram quality. Results show that including the Critic agent and running multiple iterations significantly boosts overall performance, particularly in faithfulness and conciseness, while removing the Retriever or limiting iterations degrades key metrics. The full pipeline with all modules and iterative refinement achieves the highest scores across all dimensions.
The authors use a hierarchical VLM-based evaluation to compare diagram generation methods, prioritizing faithfulness and readability over conciseness and aesthetics. Results show that their agentic framework, PAPERBANANA, significantly outperforms vanilla and few-shot baselines, achieving the highest overall score by balancing technical accuracy with visual clarity. Despite these gains, human-drawn diagrams still set the benchmark, particularly in faithfulness, highlighting remaining challenges in automated diagram generation.