Command Palette
Search for a command to run...
Ein Grundmodell für das Erdsystem
Ein Grundmodell für das Erdsystem
Zusammenfassung
Zuverlässige Prognosen des Erdsystems sind entscheidend für den Fortschritt der Menschheit und den Schutz vor Naturkatastrophen. Künstliche Intelligenz bietet erhebliches Potenzial, um die Genauigkeit und Recheneffizienz in diesem Bereich erheblich zu steigern, doch wird dieses Potenzial in vielen Anwendungsbereichen bisher kaum ausgeschöpft. Hier stellen wir Aurora vor, ein großskaliges Grundmodell für das Erdsystem, das auf über eine Million Stunden vielfältiger Daten trainiert wurde. Aurora übertrifft die Leistung bestehender operativer Prognosen für Luftqualität, Ozeanwellen, Bahnen tropischer Wirbelstürme sowie hochauflösende Wettervorhersagen – und das bei einer Rechenkostenreduzierung um Größenordnungen im Vergleich zu spezialisierten bestehenden Systemen. Da Aurora mit nur geringem rechnerischem Aufwand an diverse Anwendungsbereiche angepasst werden kann, markiert es einen bedeutenden Fortschritt hin zu handlungsorientierten Erdsystemprognosen, die für jedermann zugänglich werden.
One-sentence Summary
The authors, affiliated with Silurian AI, University of Amsterdam, University of Cambridge, Microsoft Corporation, and University of Pennsylvania, introduce Aurora, a large-scale foundation model for Earth system forecasting that achieves superior accuracy across air quality, ocean waves, tropical cyclones, and weather prediction with drastically lower computational cost than existing systems, enabling efficient fine-tuning for diverse real-world applications.
Key Contributions
- Aurora is a large-scale foundation model for the Earth system, trained on over a million hours of diverse, heterogeneous data across atmospheric chemistry, ocean waves, tropical cyclones, and weather, enabling unified modeling of multiple Earth system processes with a single architecture.
- The model leverages a 3D Swin Transformer with Perceiver-based encoders and decoders, allowing it to handle variable spatial resolutions, pressure levels, and input data types, and achieve state-of-the-art performance across tasks with minimal fine-tuning.
- Aurora outperforms operational systems—including CAMS for air quality, numerical wave models, and multiple tropical cyclone and weather forecasting centers—on key metrics while requiring orders of magnitude less computational cost, demonstrating a major leap in efficiency and accessibility.
Introduction
Earth system forecasting is critical for mitigating natural disasters and supporting sectors like agriculture, health, and energy, yet traditional numerical models are computationally expensive, complex to maintain, and limited by approximations in sub-grid processes. Prior AI approaches have largely focused on weather forecasting at coarse resolutions, with limited success in domains like atmospheric chemistry, ocean waves, and tropical cyclone tracking. The authors introduce Aurora, a 1.3-billion-parameter foundation model pre-trained on over a million hours of diverse Earth system data across multiple resolutions, variables, and pressure levels. Leveraging a 3D Swin Transformer with Perceiver-based encoders and decoders, Aurora is fine-tuned for specific forecasting tasks and demonstrates state-of-the-art performance across four key domains: air quality, ocean waves, tropical cyclone tracks, and high-resolution weather. Notably, Aurora outperforms operational systems like CAMS and IFS HRES on 74–92% of targets while running up to 50,000 times faster on a single GPU. Its ability to generalize to extreme events and be adapted to new tasks with minimal computational cost marks a significant step toward democratizing high-accuracy Earth system predictions.
Dataset
-
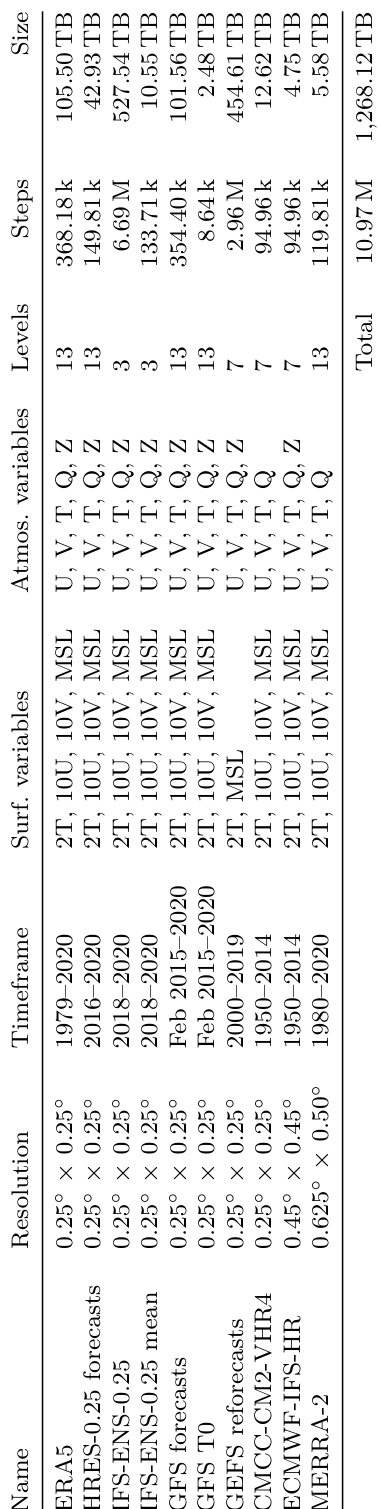
The dataset used to train and evaluate Aurora comprises five categories: analysis, reanalysis, forecast, reforecast, and climate simulation data. Key sources include ERA5, HRES operational forecasts, IFS ensemble forecasts, GFS forecasts, GEFS reforecasts, CMIP6 climate simulations, MERRA-2, and CAMS analysis, forecast, and reanalysis data.
-
The primary datasets used span a range of resolutions and temporal coverages. ERA5 is used at 0.25° resolution as a high-quality reanalysis baseline. HRES forecasts and analysis are used at 0.1° and regridded to 0.25°. IFS ENS and its mean are used at 3 pressure levels (500, 700, 850 hPa). GFS forecasts are regridded to 0.25°. GEFS reforecasts (2000–2019) use 5 ensemble members at 3 pressure levels (850, 925, 1000 hPa). CMIP6 datasets (CMCC-CM2-VHR4 and ECMWF-IFS-HR) are selected for resolution compatibility (0.25° and 0.45°) and vertical coverage across 7 pressure levels. MERRA-2 and CAMS data are used at 0.4° and 0.75° resolution, respectively, with 13 common pressure levels. HRES-WAM data is regridded to 0.25° and includes wave-specific variables.
-
Aurora is pre-trained on a mixture of datasets, with training splits defined by dataset-specific timeframes. Validation uses one year of IFS HRES at 0.25° (2020), while test periods vary by dataset (e.g., 2022–2023). For CAMS, a stable period (Jun 2021–Nov 2022) is used for fine-tuning and testing, with data from Oct 2017 onward included to ensure robustness after known data updates.
-
All variables are normalized using spatially constant mean and standard deviation derived from the full ERA5 training data. The same normalization statistics are applied across all datasets. Outputs are unnormalized post-decoding to produce final predictions. For HRES-WAM, neutral wind components (10UN, 10VN) are derived from wind magnitude (WIND) and direction (DWI) via trigonometric transformation, with a negative sign applied to account for wind direction being from rather than toward. NaNs are used to represent missing wave data (e.g., over land or sea ice), and zero significant wave height is replaced with NaN to avoid spurious values.
-
A custom multi-source data loading pipeline handles heterogeneous data. Datasets are stored in Azure blob storage with optimizations: co-location of compute and data, chunking in Zarr format, compression, and grouping of variables per timestep. Each dataset is configured via YAML files, generating lightweight BatchGenerator objects. Streams of these objects are combined, shuffled, and sharded across GPUs. After sharding, each GPU unpacks its assigned BatchGenerators by downloading, decompressing, reading, and transforming data—ensuring samples from the same dataset are batched together and workload is balanced via variable batch sizes.
-
The diverse dataset mix enables Aurora to learn scale-aware representations, robust dynamics, and physical consistency. Climate simulations expose the model to future and extreme scenarios, forecasts provide plausible atmospheric evolutions, and differences in model physics (e.g., IFS vs. GFS) reduce bias. The pipeline supports flexible experimentation with model architectures by avoiding constraints from multi-resolution token mixing.
Method
The Aurora model is structured as an encoder-decoder framework designed to process heterogeneous Earth system data and generate forecasts at arbitrary resolutions and for various variables. The overall architecture consists of three primary components: a 3D Perceiver encoder, a 3D Swin Transformer U-Net backbone, and a 3D Perceiver decoder. This modular design enables the model to ingest diverse inputs, simulate atmospheric dynamics, and produce outputs tailored to specific forecasting tasks.
The encoder transforms heterogeneous input data into a standardized 3D latent representation. It processes atmospheric variables as H×W images on a regular latitude-longitude grid, with inputs at the current time t and the previous time t−1, resulting in a T×H×W tensor for each variable. Static variables, such as orography, land-sea mask, and soil-type, are incorporated as additional surface-level variables. The input images are divided into P×P patches, which are mapped to embedding vectors of dimension D using variable-specific linear transformations. These embeddings are then tagged with additive encodings for pressure level (using sine/cosine encoding for atmospheric levels and a learned vector for the surface) and positional information. The encoder further reduces the number of physical pressure levels C to a fixed set of L=3 latent pressure levels using a Perceiver module, which employs cross-attention to aggregate information. The resulting PH×PW×L collection of embeddings is augmented with Fourier encodings for patch position, patch area, and absolute time, enabling the model to operate at different resolutions and capture temporal dynamics.
The backbone of the model is a 3D Swin Transformer U-Net, which serves as the neural simulator for evolving the latent representation over time. This architecture features a symmetric upsampling-downsampling structure with three stages, allowing for multi-scale processing of atmospheric dynamics. Each stage consists of multiple 3D Swin Transformer layers that perform local self-attention operations within fixed-size windows, emulating the local computations in numerical integration methods. Window shifting is applied every other layer to propagate information between neighboring regions, accounting for the Earth's spherical topology. The backbone includes 48 layers across three stages, with the embedding dimension doubling after each patch merging layer and halving after each patch splitting layer. This design enables efficient simulation of physical processes at multiple scales while maintaining training stability through res-post-norm layer normalization and avoiding positional biases that constrain input resolution.
The decoder reverses the operations of the encoder, converting the output of the backbone back into the original spatial and variable space. It de-aggregates the latent atmospheric pressure levels to any desired collection of pressure levels using a Perceiver layer, with queries derived from the sine/cosine embeddings of the output levels' pressure. The latent surface level is decoded directly. The decoder then reconstructs the output variables into P×P patches via variable-specific linear layers, which are dynamically constructed using weights associated with each variable. This process allows the model to generate predictions for arbitrary pressure levels and an arbitrary set of variables.
The model is trained in two phases: pretraining and fine-tuning. During pretraining, Aurora learns a general-purpose representation of Earth system dynamics by minimizing the next time-step (6-hour lead time) mean absolute error (MAE) on a mixture of forecasts, analysis data, reanalysis data, and climate simulations. This phase leverages a vast dataset and extensive computational resources, training for approximately two and a half weeks on 32 A100 GPUs. The pretraining objective is defined as a weighted sum of surface and atmospheric losses, with dataset-specific weights to account for data fidelity. The model's performance is enhanced by scaling both the volume of pretraining data and the model size, with validation performance improving systematically as more datasets are added and by approximately 6% for every 10× increase in model size. Fine-tuning then adapts the pretrained model to new tasks, datasets, and variables using a much smaller amount of data and computational cost. For specific applications, such as air pollution or wave forecasting, the model is further adapted with modifications to the architecture, input processing, and training objectives to better capture the unique characteristics of the target variables.
Experiment
- Main experiments: Pretraining on diverse datasets (C4 configuration), fine-tuning with LoRA for roll-out, and high-resolution (0.1°) modeling.
- Core results: On HRES-T0 2022 at 0.25° resolution, Aurora outperforms GraphCast (94% of targets) and Pangu-Weather, with up to 40% RMSE reduction in the upper atmosphere; on 0.1° resolution, Aurora achieves 5.4% higher R² for meso-β-scale processes compared to 0.25° regridded predictions; on weather station data, Aurora outperforms IFS HRES for wind speed up to 10 days; on extreme events, Aurora reduces thresholded RMSE by up to 35% compared to ERA5-only pretraining; on CAMS and HRES-WAM, Aurora matches or exceeds operational models on 76% and 85% of targets, respectively.
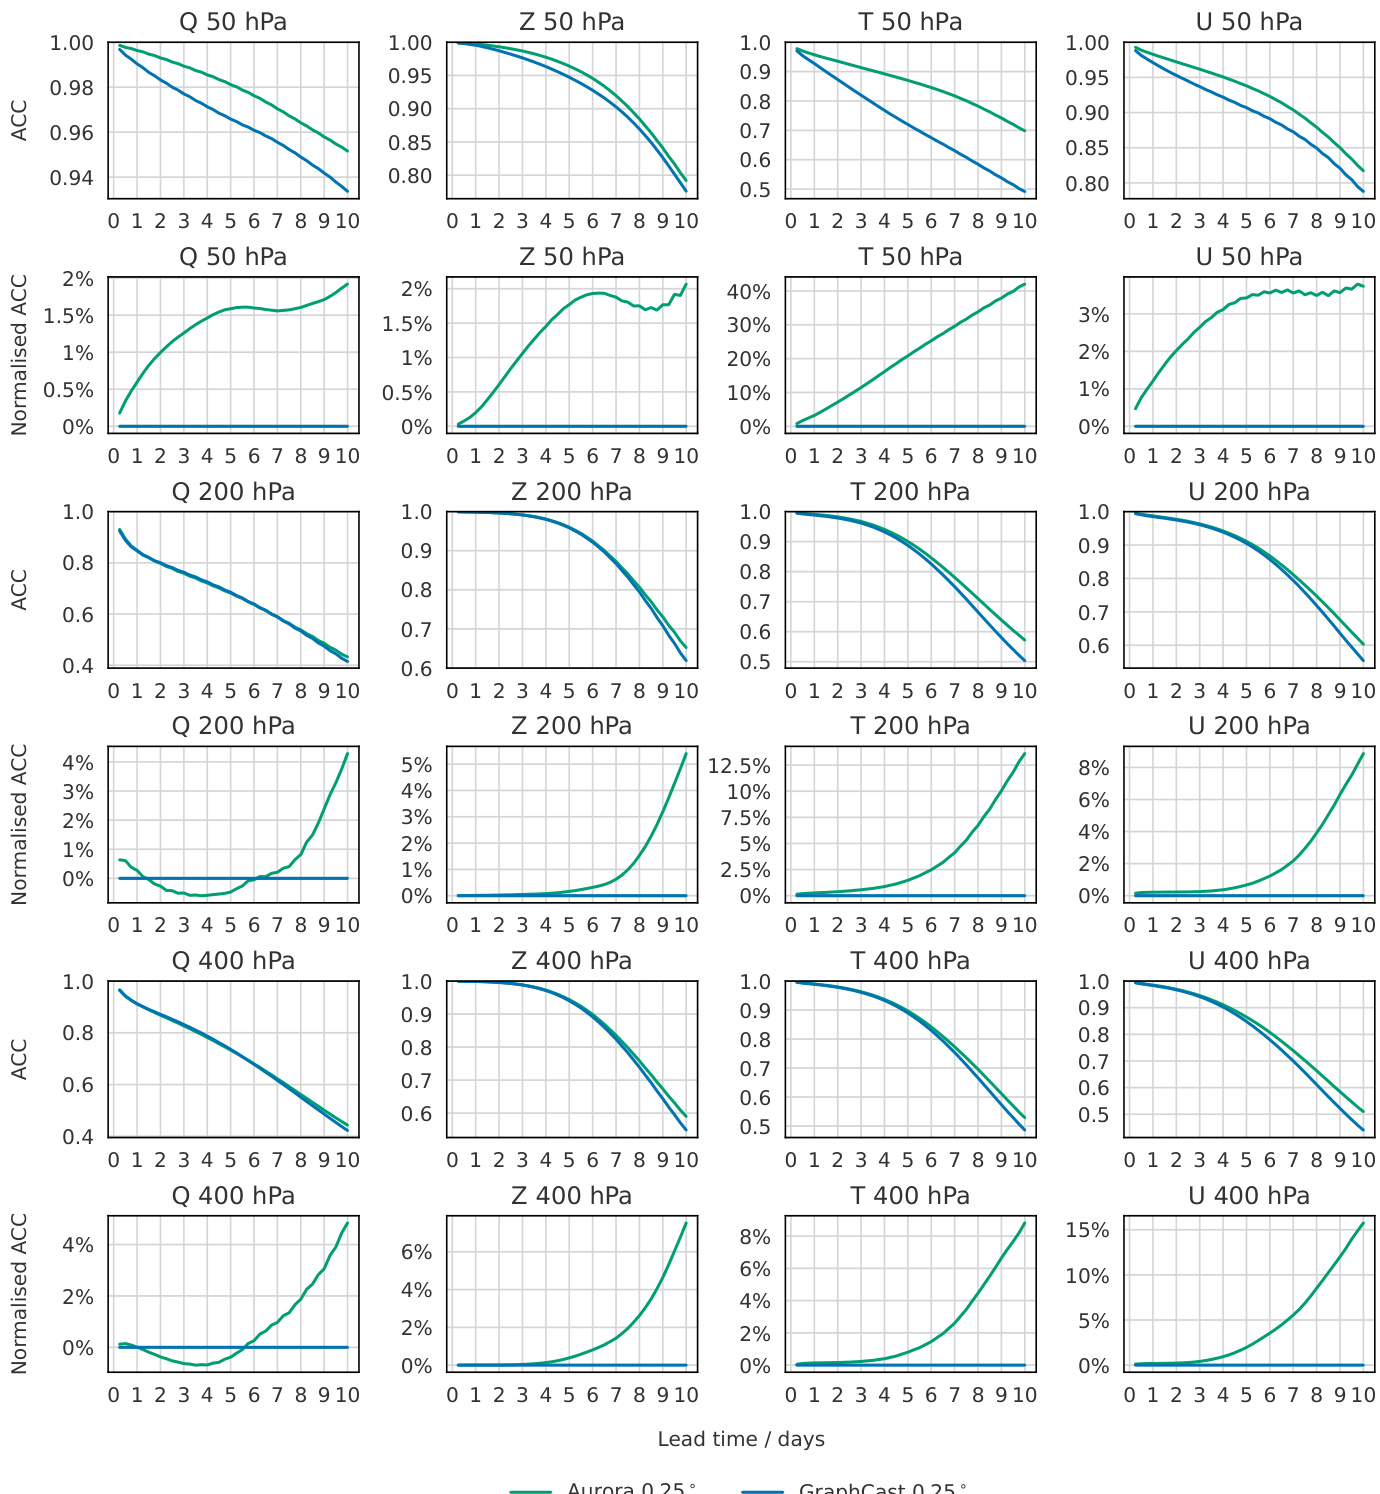
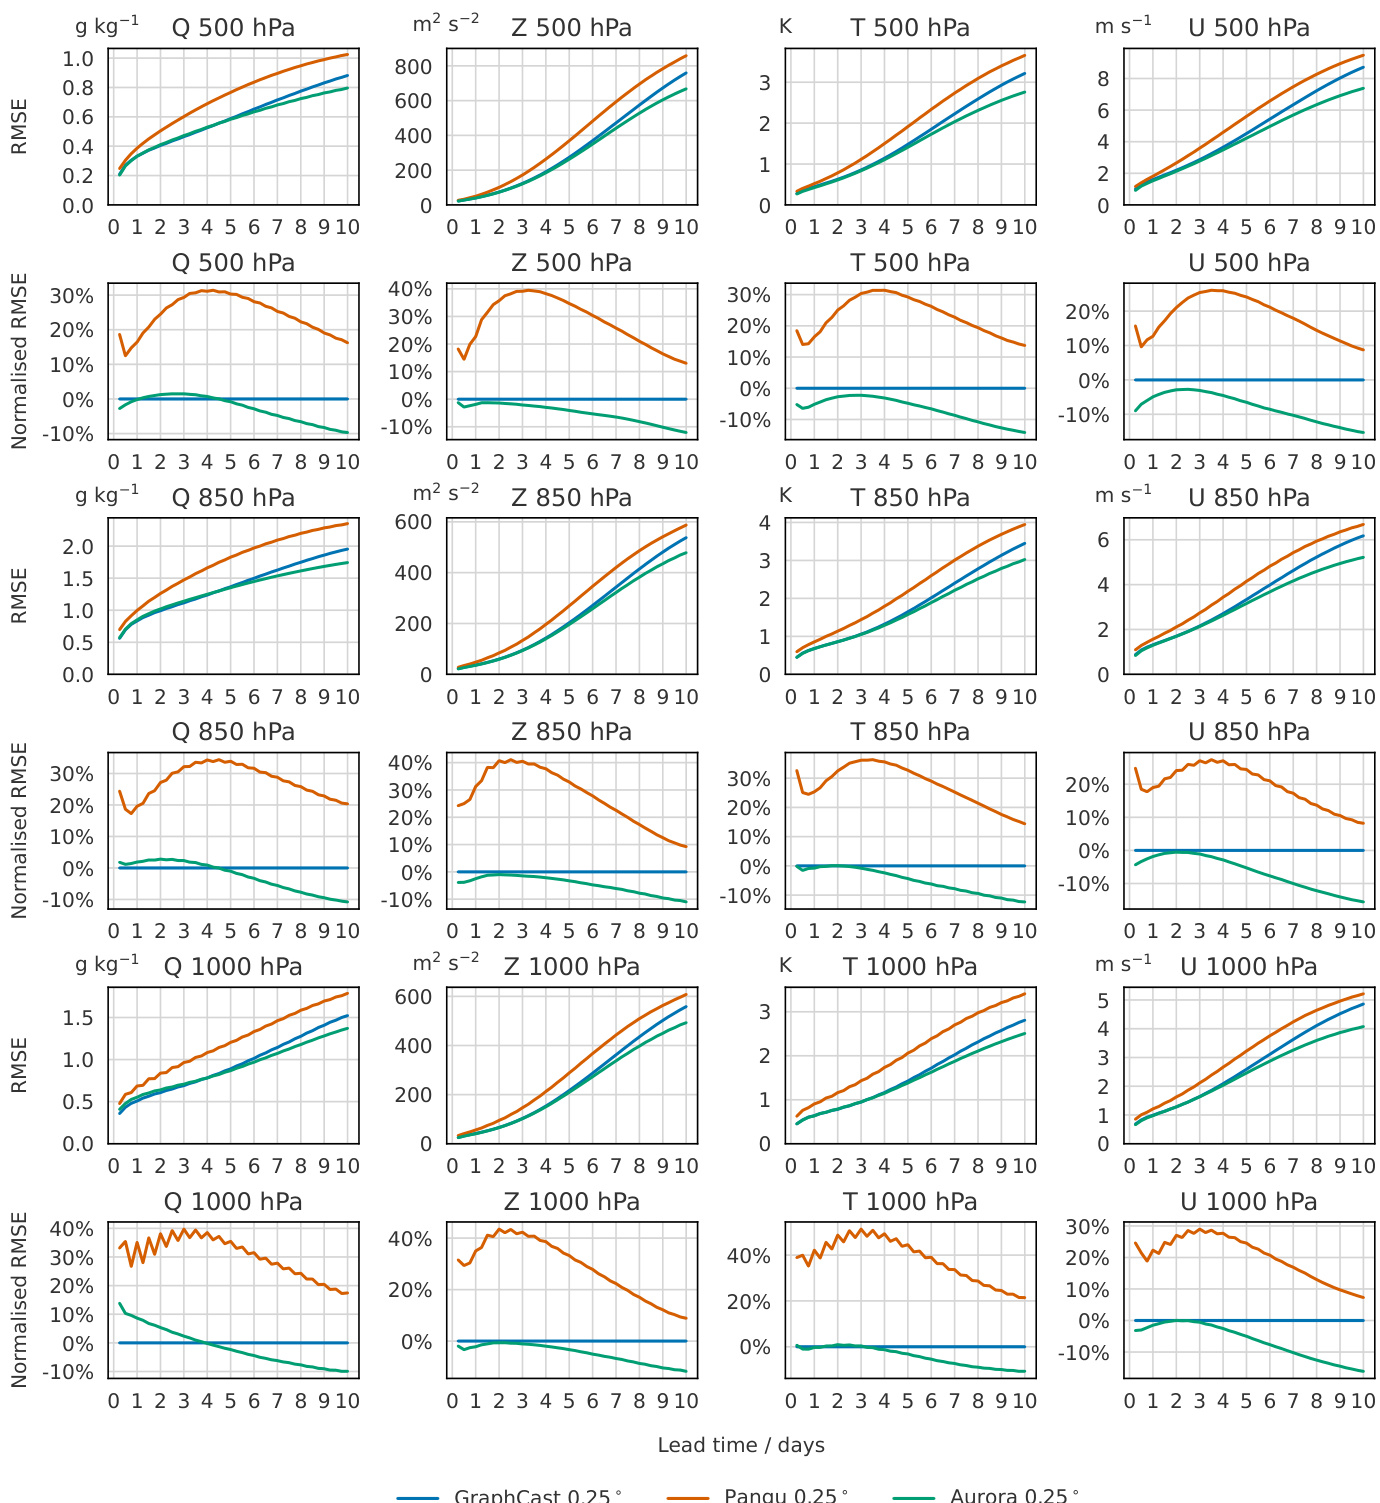
The authors use a multi-stage training approach for Aurora, beginning with pretraining on diverse datasets and fine-tuning on specific tasks. Results show that Aurora consistently outperforms GraphCast and Pangu-Weather at 0.25° resolution across most variables and lead times, with the largest improvements observed in the upper atmosphere.
The authors compare the performance of Aurora, GraphCast, and Pangu-Weather at 0.25° resolution across multiple atmospheric variables and pressure levels. Results show that Aurora consistently outperforms both GraphCast and Pangu-Weather, with the largest improvements observed in the upper atmosphere, where Aurora reduces RMSE by up to 40% compared to GraphCast. Aurora also demonstrates superior performance in predicting extreme weather events, particularly in the tails of the distribution for surface variables like wind speed and temperature.
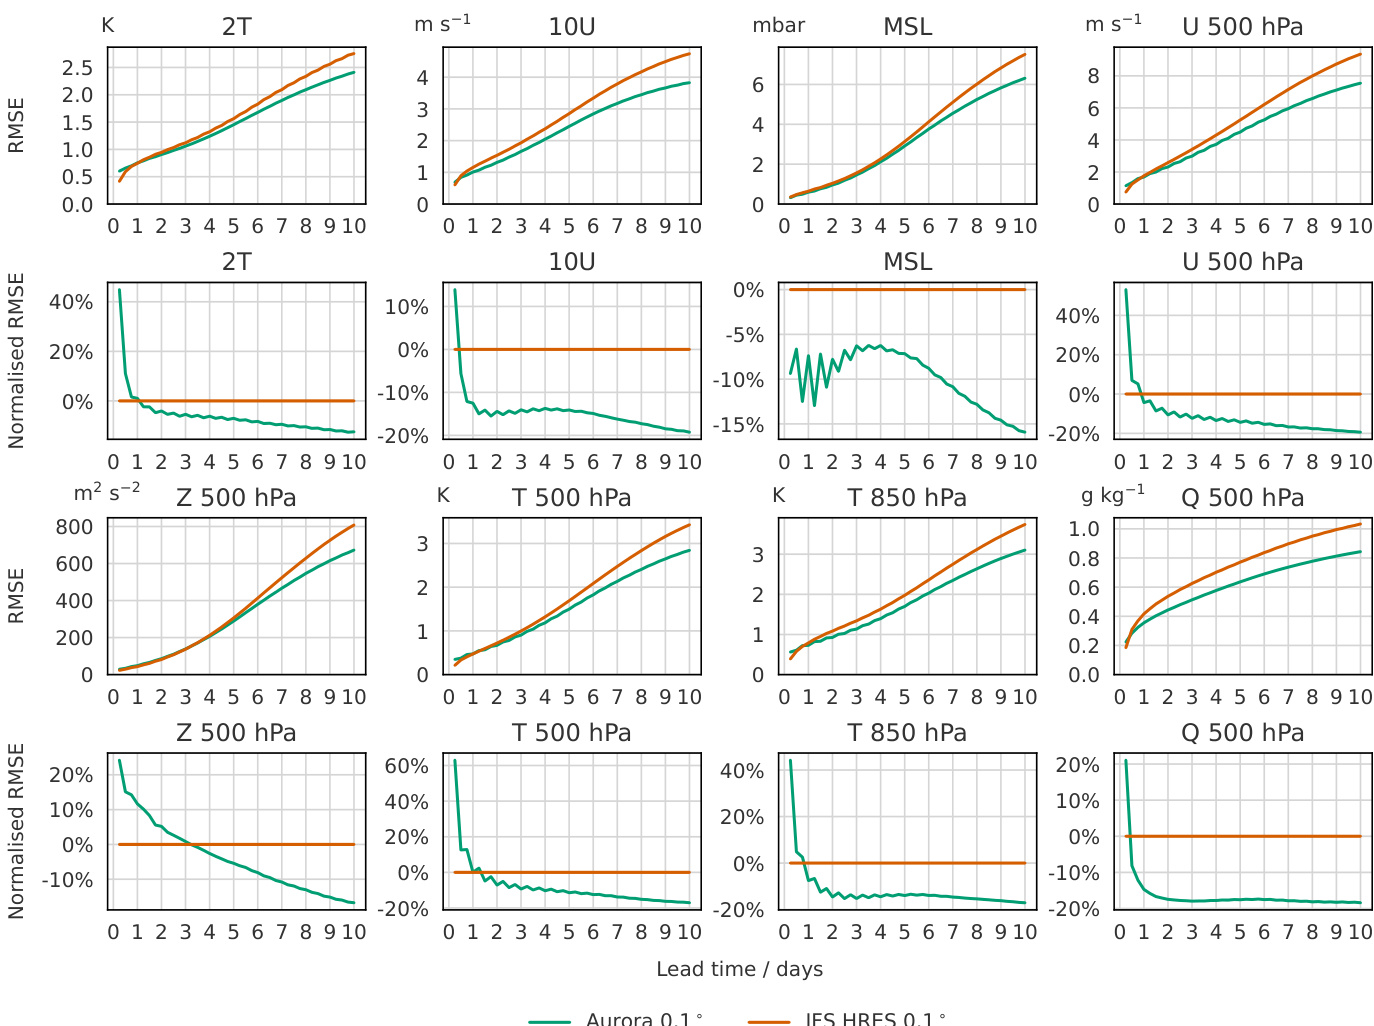
The authors use a series of line plots to compare the performance of Aurora at 0.1° resolution against IFS HRES at 0.1° resolution across various atmospheric variables and pressure levels. The top row of plots shows the root mean square error (RMSE) for variables like 2T, 10U, MSL, and U 500 hPa, where Aurora's error is consistently lower than IFS HRES's error across all lead times. The bottom row of plots shows the normalized RMSE, which is the difference in RMSE between the two models relative to IFS HRES's RMSE, indicating that Aurora's performance is significantly better, especially at longer lead times. The results show that Aurora outperforms IFS HRES in most variables and pressure levels, with the largest improvements seen in the upper atmosphere.
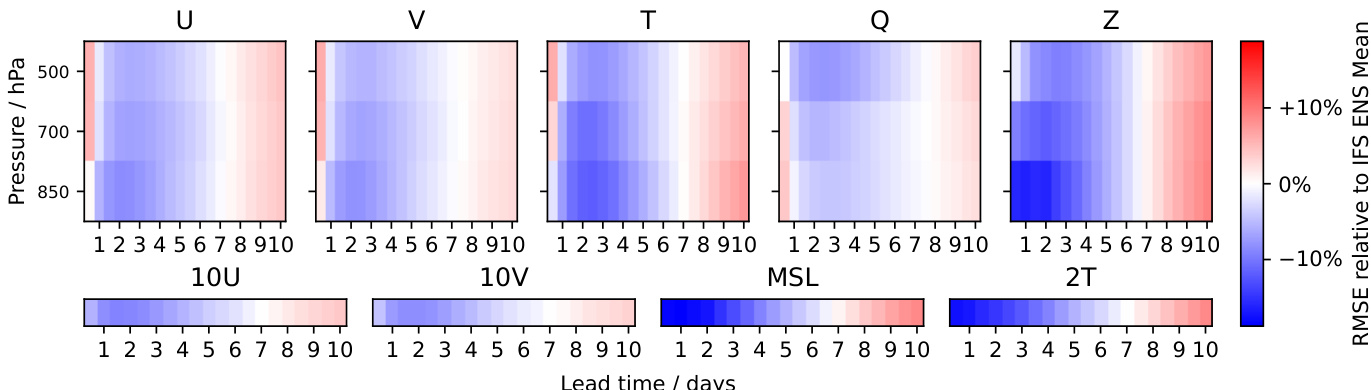
The authors use a series of heatmaps to compare the relative root mean square error (RMSE) of Aurora's predictions against IFS HRES analysis across different atmospheric variables, pressure levels, and lead times. The results show that Aurora's performance varies significantly by variable and pressure level, with the largest improvements over IFS HRES occurring in the upper atmosphere for variables like U, V, and Z, where errors are reduced by up to 10%. For surface variables such as 2T and MSL, Aurora's errors are generally smaller than IFS HRES at short lead times but become comparable or slightly worse at longer lead times. The performance for specific humidity (Q) remains consistently poor across all lead times and pressure levels, indicating a persistent challenge for the model.
The authors compare Aurora and GraphCast at 0.25° resolution across multiple atmospheric variables and pressure levels, using anomaly correlation coefficient (ACC) and normalized ACC metrics. Results show that Aurora consistently outperforms GraphCast across most variables and lead times, with the largest improvements observed in the upper atmosphere, where Aurora reduces ACC errors by up to 40% compared to GraphCast. The performance gap widens at longer lead times, particularly beyond three days, and Aurora also outperforms GraphCast at short lead times for variables such as temperature, geopotential height, and wind components.