Command Palette
Search for a command to run...
Benchmark^2 : Évaluation systématique des benchmarks pour les LLM
Benchmark^2 : Évaluation systématique des benchmarks pour les LLM
Résumé
La prolifération rapide des benchmarks destinés à évaluer les grands modèles linguistiques (LLM) a créé un besoin urgent de méthodes systématiques pour évaluer la qualité des benchmarks eux-mêmes. Nous proposons Benchmark^2, un cadre complet composé de trois métriques complémentaires : (1) la Consistance du classement entre benchmarks, qui mesure si un benchmark produit des classements de modèles alignés avec ceux des benchmarks pairs ; (2) le Score de discriminabilité, qui quantifie la capacité d’un benchmark à distinguer entre différents modèles ; et (3) l’Écart d’alignement des capacités, qui permet d’identifier des cas problématiques où des modèles plus performants échouent alors que des modèles moins performants réussissent au sein de la même famille de modèles. Nous menons des expériences approfondies sur 15 benchmarks couvrant les domaines des mathématiques, du raisonnement et des connaissances, en évaluant 11 LLMs issus de quatre familles de modèles. Notre analyse révèle des variations importantes de qualité parmi les benchmarks existants, et démontre que la construction sélective de benchmarks fondée sur nos métriques permet d’atteindre une performance d’évaluation comparable tout en réduisant considérablement la taille des jeux de tests.
One-sentence Summary
The authors from Fudan University, Washington University in St. Louis, and Xiaohongshu Inc. propose BENCHMARK², a framework with three metrics—Cross-Benchmark Ranking Consistency, Discriminability Score, and Capability Alignment Deviation—to systematically evaluate LLM benchmarks, enabling more reliable and efficient model assessment by identifying high-quality, low-redundancy test sets across mathematics, reasoning, and knowledge domains.
Key Contributions
- Existing LLM benchmarks suffer from critical flaws such as inconsistent model rankings, poor ability to differentiate between models, and counter-intuitive instances where weaker models outperform stronger ones, undermining their reliability as evaluation tools.
- The paper introduces BENCHMARK², a framework with three novel metrics—Cross-Benchmark Ranking Consistency, Discriminability Score, and Capability Alignment Deviation—that systematically assess benchmark quality across ranking alignment, discriminative power, and hierarchical consistency.
- Experiments on 15 benchmarks and 11 LLMs across four model families show that high-quality benchmarks can be identified and that selective construction using these metrics achieves comparable evaluation performance with only 35% of the original test data.
Introduction
The evaluation of large language models (LLMs) relies heavily on benchmarks, which guide research and deployment decisions across domains like mathematics, reasoning, and knowledge. However, the rapid proliferation of benchmarks has outpaced systematic quality assessment, leading to issues such as inconsistent model rankings, poor discriminative power, and counter-intuitive performance patterns where weaker models outperform stronger ones. Prior work has addressed specific problems like data contamination or statistical significance but lacks a unified, quantitative framework for evaluating benchmark reliability. The authors introduce BENCHMARK², a systematic framework with three metrics: Cross-Benchmark Ranking Consistency (CBRC) to measure alignment with peer benchmarks, Discriminability Score (DS) to quantify a benchmark’s ability to differentiate models, and Capability Alignment Deviation (CAD) to detect rank-inconsistent items. Evaluated across 15 benchmarks and 11 LLMs, the framework reveals significant quality disparities and demonstrates that selecting high-quality test instances using these metrics enables comparable evaluation performance with only 35% of the original data, offering a more efficient path for benchmark construction.
Dataset

- The dataset comprises 15 public benchmarks across three domains: Mathematics (5 benchmarks), General Reasoning (5 benchmarks), and Knowledge & Understanding (5 benchmarks), drawn from established, publicly available sources.
- The benchmarks include AIME 2024, OmniMath, OlympiadBench, AMC, and MATH-500 for mathematics; Big-Bench Hard, DROP, ARC, CommonsenseQA, and SIQA for general reasoning; and SuperGPQA, MMLU-Pro, IFBench, IFEval, and EQ-Bench for knowledge and understanding.
- The authors filter test instances using a quality-based selection strategy, retaining only those with high CAD scores (indicating low inversion rates) and high discriminability contributions, resulting in filtered benchmarks containing approximately 35% of the original instances.
- The filtered benchmarks are used to train and evaluate the model, with mixture ratios derived from the Benchmark Quality Score (BQS), which combines three metrics: CAD (instance-level capability hierarchy adherence), DS (internal discriminative power), and CBRC (external consistency).
- To ensure consistent scaling across metrics, CBRC is normalized from [-1, 1] to [0, 1] using a linear transformation, while DS and CAD are already on a [0, 1] scale.
- The final BQS is computed as a weighted sum: 0.3 × normalized CBRC + 0.3 × DS + 0.4 × CAD, with CAD receiving the highest weight due to its direct measurement of fundamental benchmark quality at the instance level.
Method
The authors leverage a comprehensive framework, BENCHMARK2, to evaluate the quality of language model benchmarks by addressing three core challenges: ranking inconsistency and bias, low discriminative power of performance gaps, and the prevalence of rank-inconsistent items. The framework is structured around three complementary metrics designed to assess different aspects of benchmark reliability.
Refer to the framework diagram 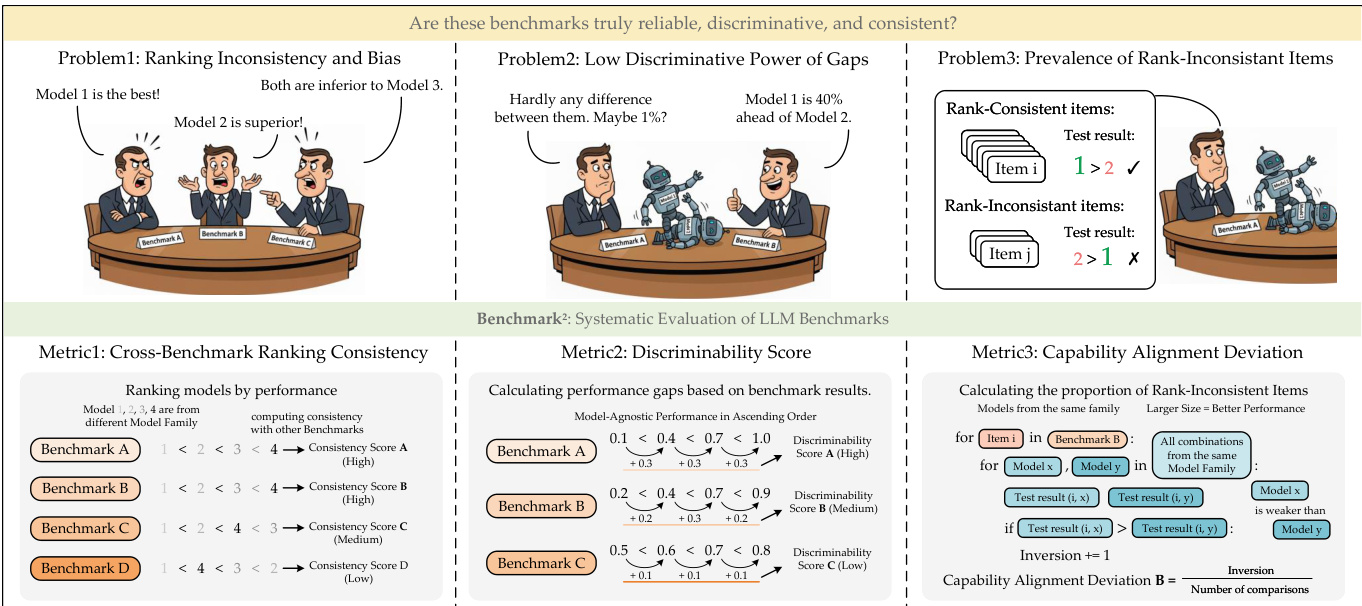 for an overview of the three problems and the corresponding metrics. The first metric, Cross-Benchmark Ranking Consistency (CBRC), evaluates the consistency of model rankings across different benchmarks. It computes a consistency score for each benchmark by comparing the relative performance of models across benchmarks, where a higher score indicates greater consistency in the ranking of models.
The second metric, Discriminability Score, quantifies the ability of a benchmark to distinguish between models of varying performance levels. As shown in the figure below, this is computed by analyzing the performance gaps between models, with the discriminability score reflecting the magnitude of these gaps. A higher discriminability score indicates that the benchmark can effectively differentiate between models, particularly when the performance differences are small.
The third metric, Capability Alignment Deviation (CAD), operates at the instance level to identify individual test questions that may be problematic due to violations of expected capability hierarchies. The authors define a model family hierarchy based on parameter count within a family, such that larger models are expected to outperform smaller ones. For a given benchmark, the inversion rate is computed by counting instances where a stronger model fails to answer a question correctly while a weaker model succeeds. This rate is then transformed using an exponential function to produce a CAD score, where higher values indicate better alignment with the expected capability hierarchy. The formula for CAD is given by CAD(Bi)=e−λ⋅inv_rate(Bi), with λ=12 used in the experiments to ensure meaningful differentiation.
Finally, a combined Benchmark Quality Score (BQS) is derived by aggregating the normalized CBRC, discriminability score, and CAD, weighted by parameters α, β, and γ respectively. This provides a holistic assessment of benchmark quality.
Experiment
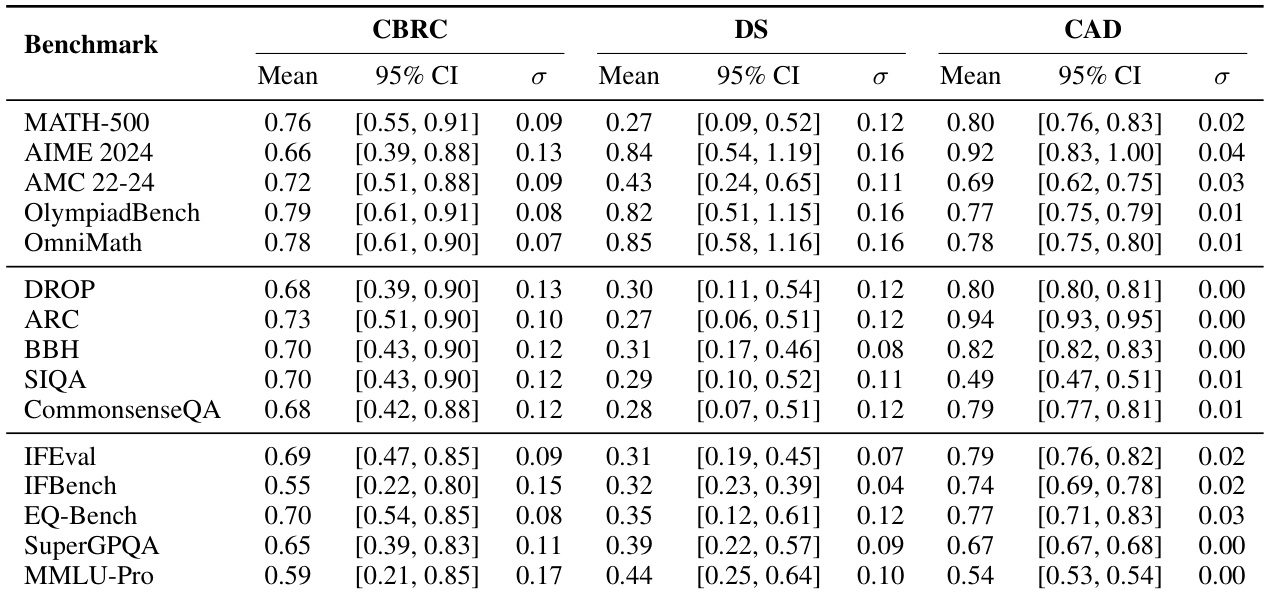
- AIME 2024 achieved high discriminability (DS = 0.74) and capability alignment (CAD = 0.85), validating its effectiveness in differentiating model capabilities in mathematics.
- BBH demonstrated strong discriminability (DS = 0.25) but lower alignment (CAD = 0.66), highlighting a trade-off between these metrics in general reasoning.
- IFEval and SuperGPQA showed consistent quality across domains with high cross-benchmark consistency (CBRC > 0.75), indicating reliable evaluation.
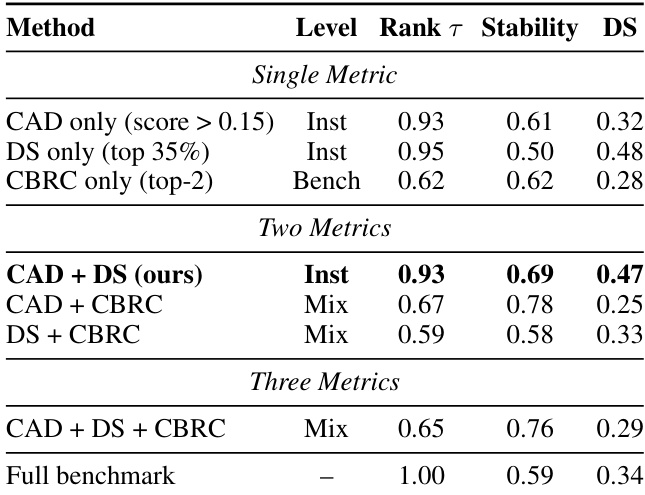
- Selective evaluation using 35% of instances maintained high ranking consistency (Kendall’s τ = 0.93) and improved stability (0.69) compared to full benchmarks (0.59), validating the efficiency of instance selection.
- The CAD+DS combination for instance selection achieved the best balance, with strong ranking consistency (0.93), improved stability (0.69), and good discriminability (0.47).
- Held-out validation on Qwen2.5-Base models confirmed generalization, with near-perfect rank preservation in mathematics (Avg |ΔRk| = 0.0) and consistent performance across model families.
- Llama models showed near-perfect CAD on several benchmarks (e.g., AIME: 1.00), while Qwen3 exhibited higher variation, and SIQA consistently scored low (CAD = 0.20–0.27), indicating design flaws.
- Benchmarks with objective evaluation criteria achieved higher CAD scores, and high-quality benchmarks (e.g., AIME 2024, BQS = 0.79) balanced discriminability, alignment, and consistency.
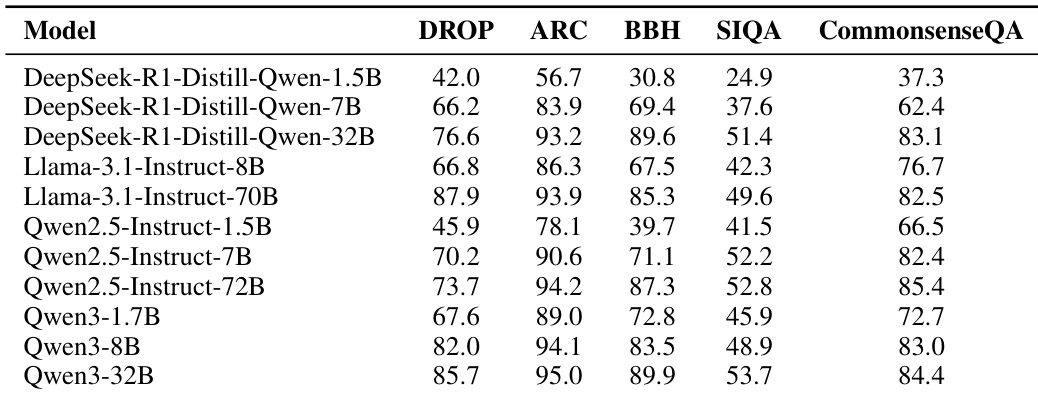
The authors use the provided table to analyze model performance across five general reasoning benchmarks, showing clear capability hierarchies within each model family. Results show that larger models consistently outperform smaller ones, with Qwen3-32B achieving the highest scores on most benchmarks, indicating strong scaling behavior across families.
Results show that the AIME 2024 benchmark achieves the highest discriminability score (DS = 0.84) and capability alignment deviation (CAD = 0.92), indicating strong differentiation between models and high consistency with within-family capability hierarchies. In contrast, benchmarks like SIQA and BBH exhibit lower discriminability and alignment, reflecting weaker quality profiles across model families.
The authors use a combination of metrics to evaluate the effectiveness of selective benchmark construction. Results show that the CAD + DS combination achieves the highest ranking consistency (τ = 0.93) and stability (0.69) while maintaining good discriminability (DS = 0.47), outperforming single-metric approaches and other multi-metric combinations.
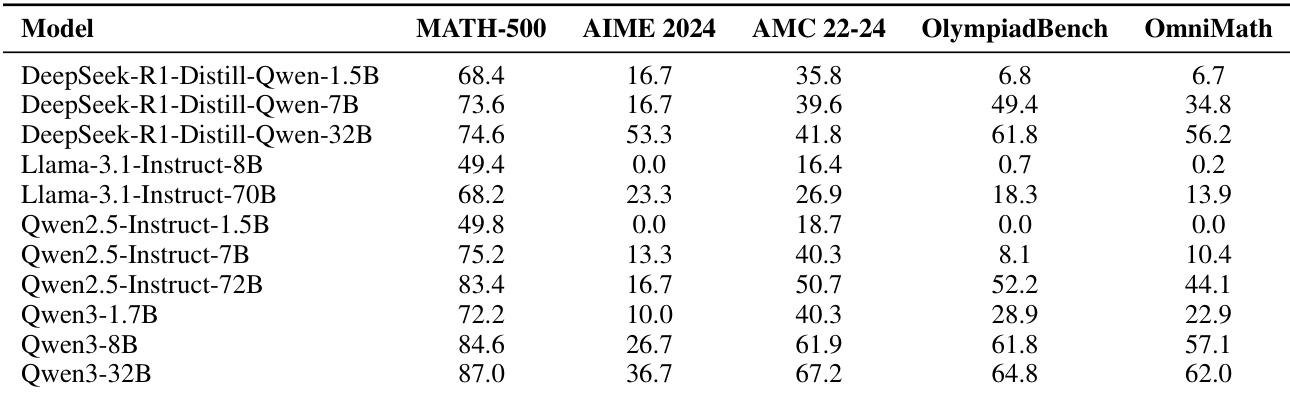
The authors use the provided table to analyze model performance across five mathematics benchmarks, showing clear capability hierarchies within each model family. Results indicate that larger models consistently outperform smaller ones, with Qwen3-32B achieving the highest scores on most benchmarks, and the performance trends align with the expected scaling behavior across model sizes.
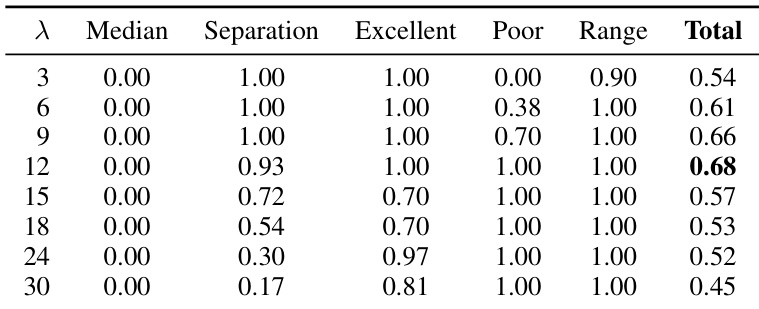
The authors use a systematic analysis to select the optimal value for the lambda parameter in the Capability Alignment Deviation (CAD) metric, evaluating candidate values based on five criteria including median mapping, quality separation, and dynamic range preservation. Results show that λ = 12 achieves the highest total score of 0.68, providing strong quality separation, perfect reward for excellent benchmarks, and full penalty for poor ones, making it the best choice for transforming raw inversion rates into interpretable CAD scores.