HyperAI
Command Palette
Search for a command to run...
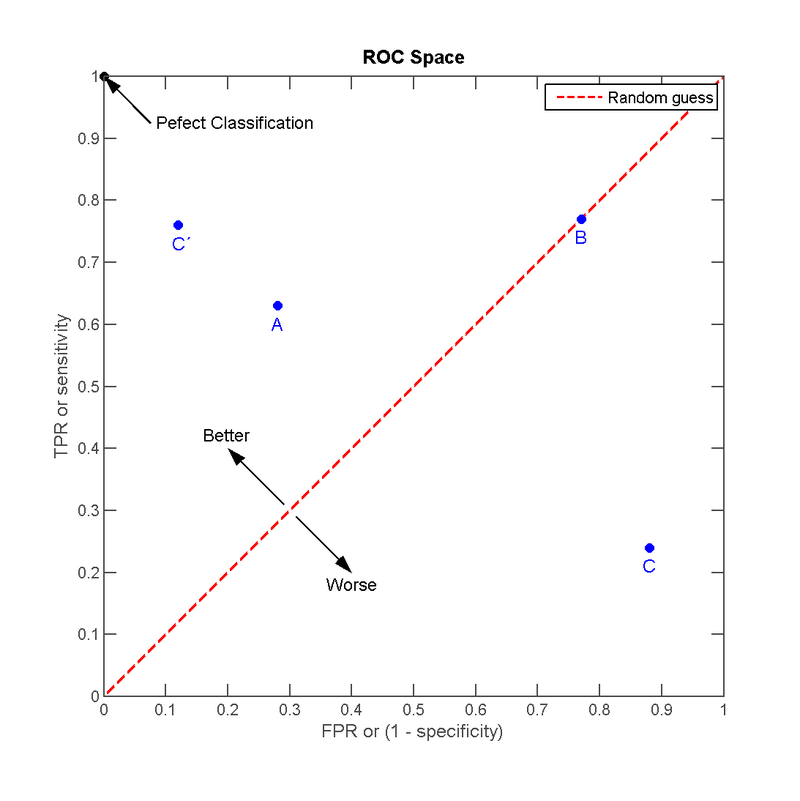
Receiver Operating Characteristic
Date
3 years ago
| True category | Prediction is positive | Prediction is negative |
| Positive Example | TP (True Positive) | FN (False Negative Example) |
| Counterexample | FP (False Positive) | TN (True Counterexample) |
Build AI with AI
From idea to launch — accelerate your AI development with free AI co-coding, out-of-the-box environment and best price of GPUs.
AI Co-coding
Ready-to-use GPUs
Best Pricing
HyperAI Newsletters
Subscribe to our latest updates
We will deliver the latest updates of the week to your inbox at nine o'clock every Monday morning
Powered by MailChimp