Command Palette
Search for a command to run...
Nonlinear Dynamic Response Analysis of the Koyna Earthquake Considering Hydrodynamic Pressure
Tutorial Introduction
Introduction to Abaqus
Abaqus is a powerful finite element analysis (FEA) software widely used in engineering simulation. It simulates and analyzes various engineering problems through the finite element method, and can handle simple linear problems to complex nonlinear problems. Abaqus was originally released in 1978 and developed by Hibbitt, Karlsson & Sorensen, Inc. (HKS), which was later renamed ABAQUS and acquired by Dassault Systèmes in 2005.
Tutorial Introduction
This tutorial is the official Abaqus tutorial:Seismic analysis of concrete gravity damThis example illustrates a typical application of the damaged plasticity material model for concrete to evaluate the stability and damage of concrete structures under arbitrary loading.
The tutorial analyzes the Koyna Dam, which was hit by a magnitude 6.5 earthquake on December 11, 1967. This problem was chosen because it has been extensively analyzed by many researchers, including Chopra and Chakrabarti (1973), Bhattacharjee and Léger (1993), Ghrib and Tinawi (1995), Cervera et al. (1996), and Lee and Fenves (1998).
Basic parameter introduction
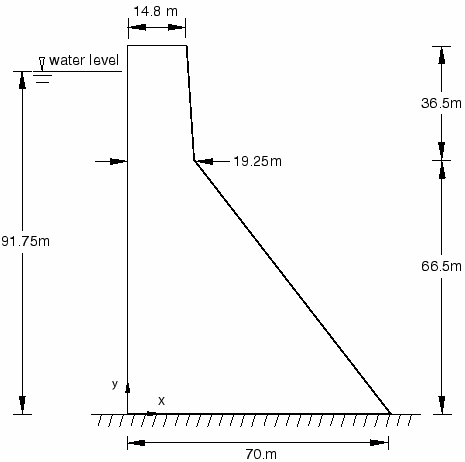
The cross-sectional geometry of a typical non-overflow section of the Koyna Dam is shown in Figure 1. The dam section is 103 m high and 71 m wide at the bottom. The upstream face of the dam section is assumed to be vertical. The water depth of the reservoir at the time of the earthquake is hw=91.75m. According to the researchers’ approach, a two-dimensional analysis of the non-overflow dam section under plane stress conditions was considered.
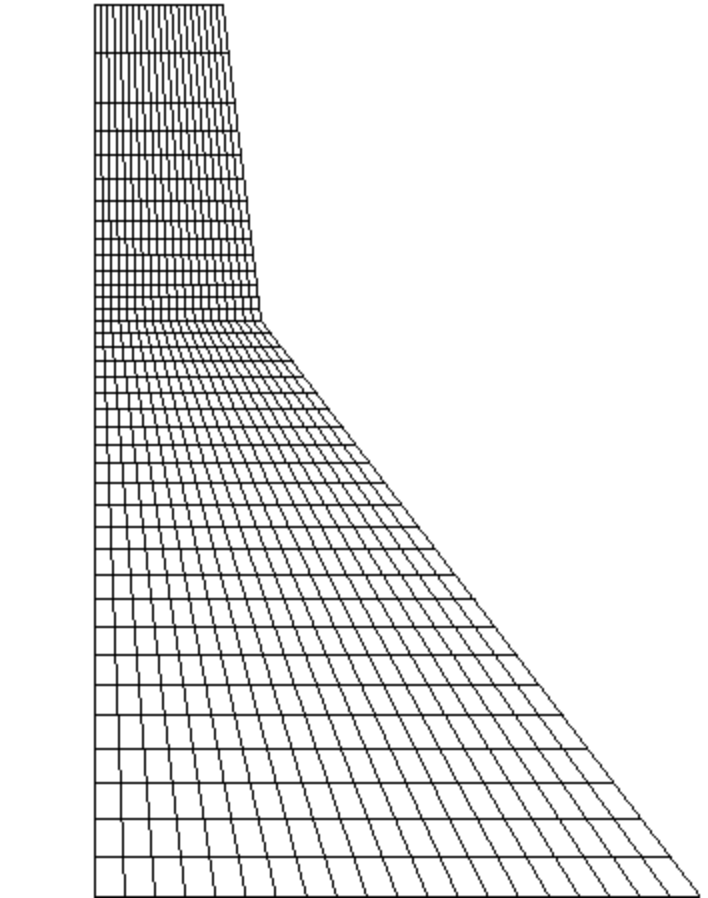
The finite element mesh used for the analysis is shown in Figure 2. The mesh consists of 760 first-order, reduced-integration, plane stress elements (CPS4R). The nodes are defined in a global rectangular coordinate system centered at the lower left corner of the dam, with the vertical y-axis pointing upward and the horizontal x-axis pointing downstream.
In this example, we neglect the interaction between the dam and the foundation by assuming that the foundation is rigid. The dynamic interaction between the dam and the reservoir, due to the lateral component of the ground motion, can be modeled in a simple form by the Westergaard added mass technique. According to Westergaard (1933), the hydrodynamic pressure exerted by the water on the dam during an earthquake is equivalent to a certain volume of water moving back and forth with the dam, while the rest of the reservoir remains stationary. The added mass per unit area of the upstream face can be approximated by , where y ≤ hw, ρw=1000kg/m3 is the density of water. In Abaqus/Standard analysis, the added mass method is implemented by a simple 2-node user element coded in the user subroutine UEL. Since the hydrodynamic pressure due to the vertical component of the ground motion is considered small, it is neglected in all simulations.
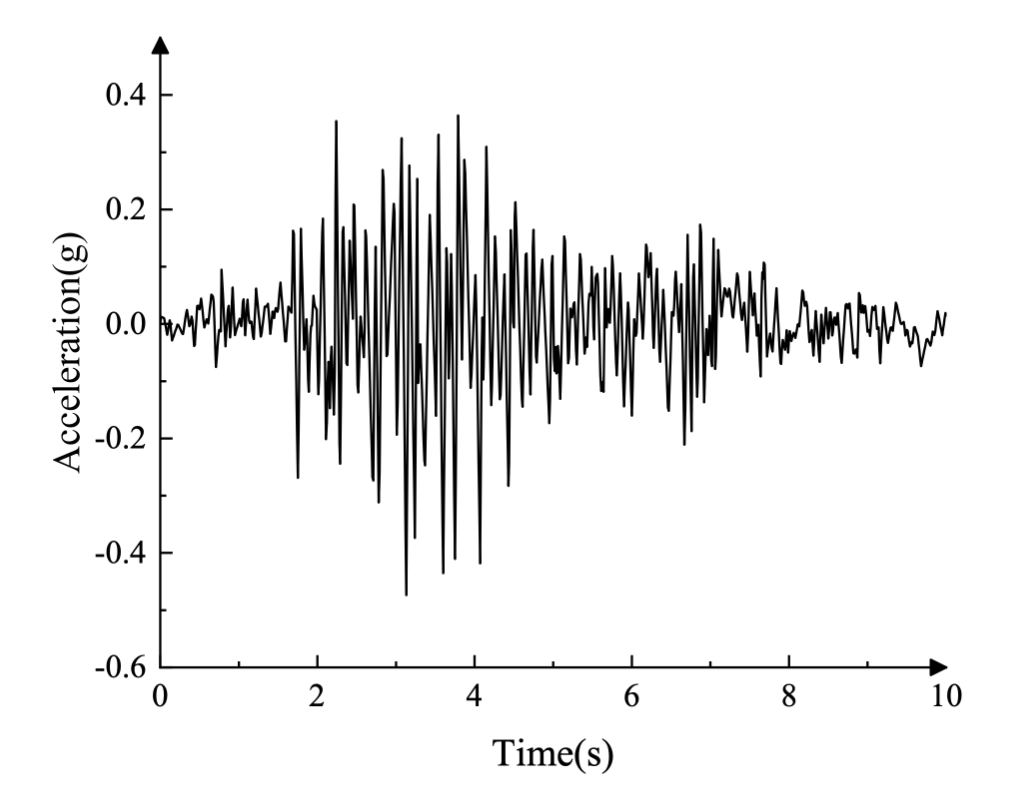
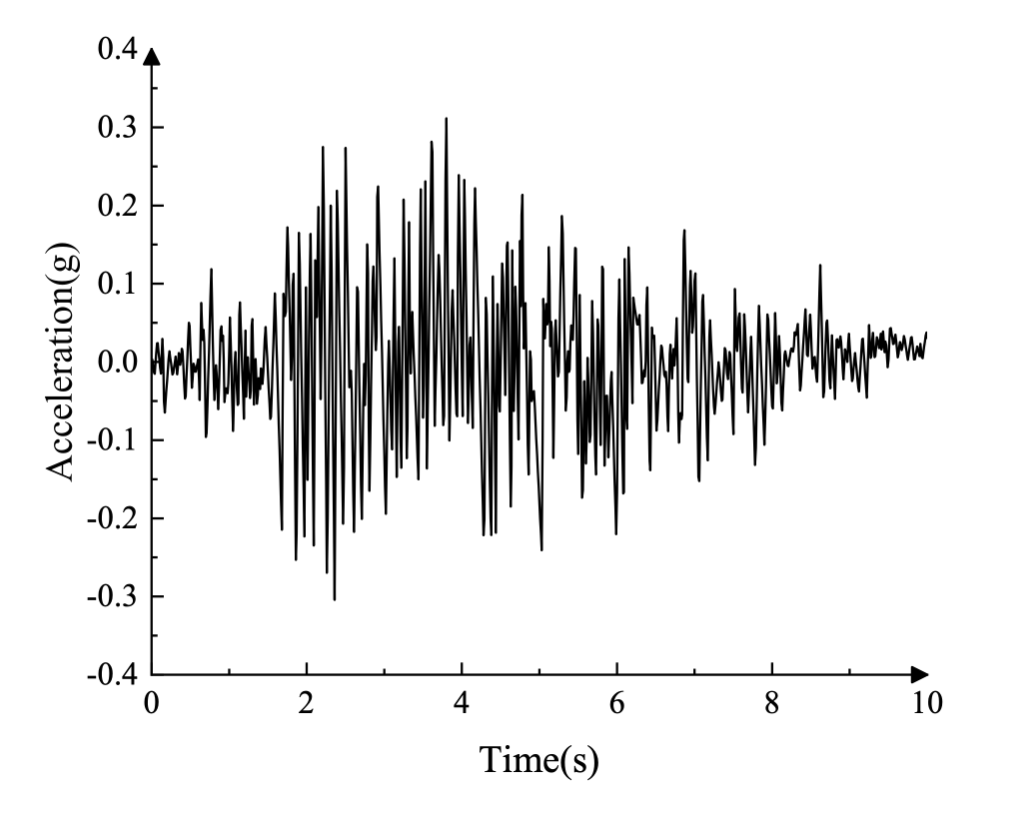
The lateral and vertical components of the ground acceleration recorded during the Koyna earthquake are shown in Figure 3 (in g = 9.81 m/s²). Before the earthquake excitation, the dam was subject to gravity loads due to its own weight and to the hydrostatic pressure of the reservoir on the upstream face.
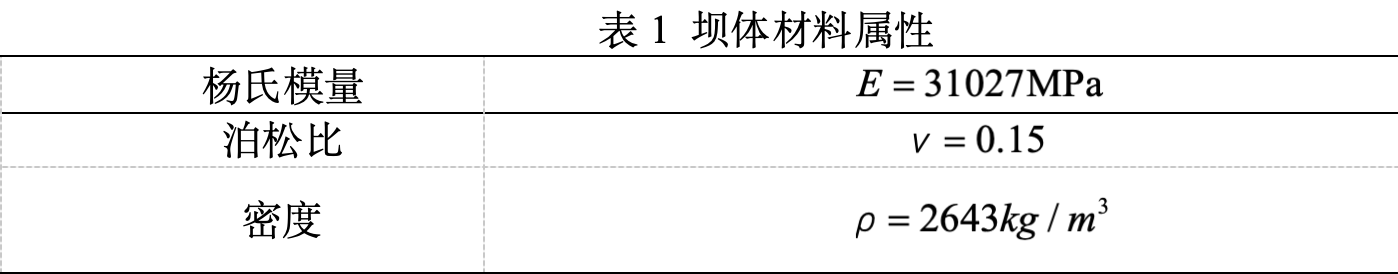
The mechanical behavior of the concrete material was simulated using the damaged plasticity constitutive model for concrete. The material properties used for the simulation are given in Table 1 and Figure 4. These properties are considered representative of the concrete material for Koyna Dam and are based on the properties used by previous researchers. Some assumptions were made while obtaining these material properties. Of particular note is the calibration of the tensile behavior of concrete. The tensile strength was estimated as the ultimate compressive strength σcu = 10% of 24.1 MPa, and multiplied by a dynamic magnification factor of 1.2 to account for rate effects; therefore, σt0 = 2.9 MPa. In order to avoid inappropriate results from mesh sensitivity due to the lack of reinforcement in the structure, the behavior after tensile failure is given by specifying a stress/displacement curve instead of a stress-strain curve, as shown in Figure 4.1. This is achieved by means of a post-cracking stress/displacement curve.
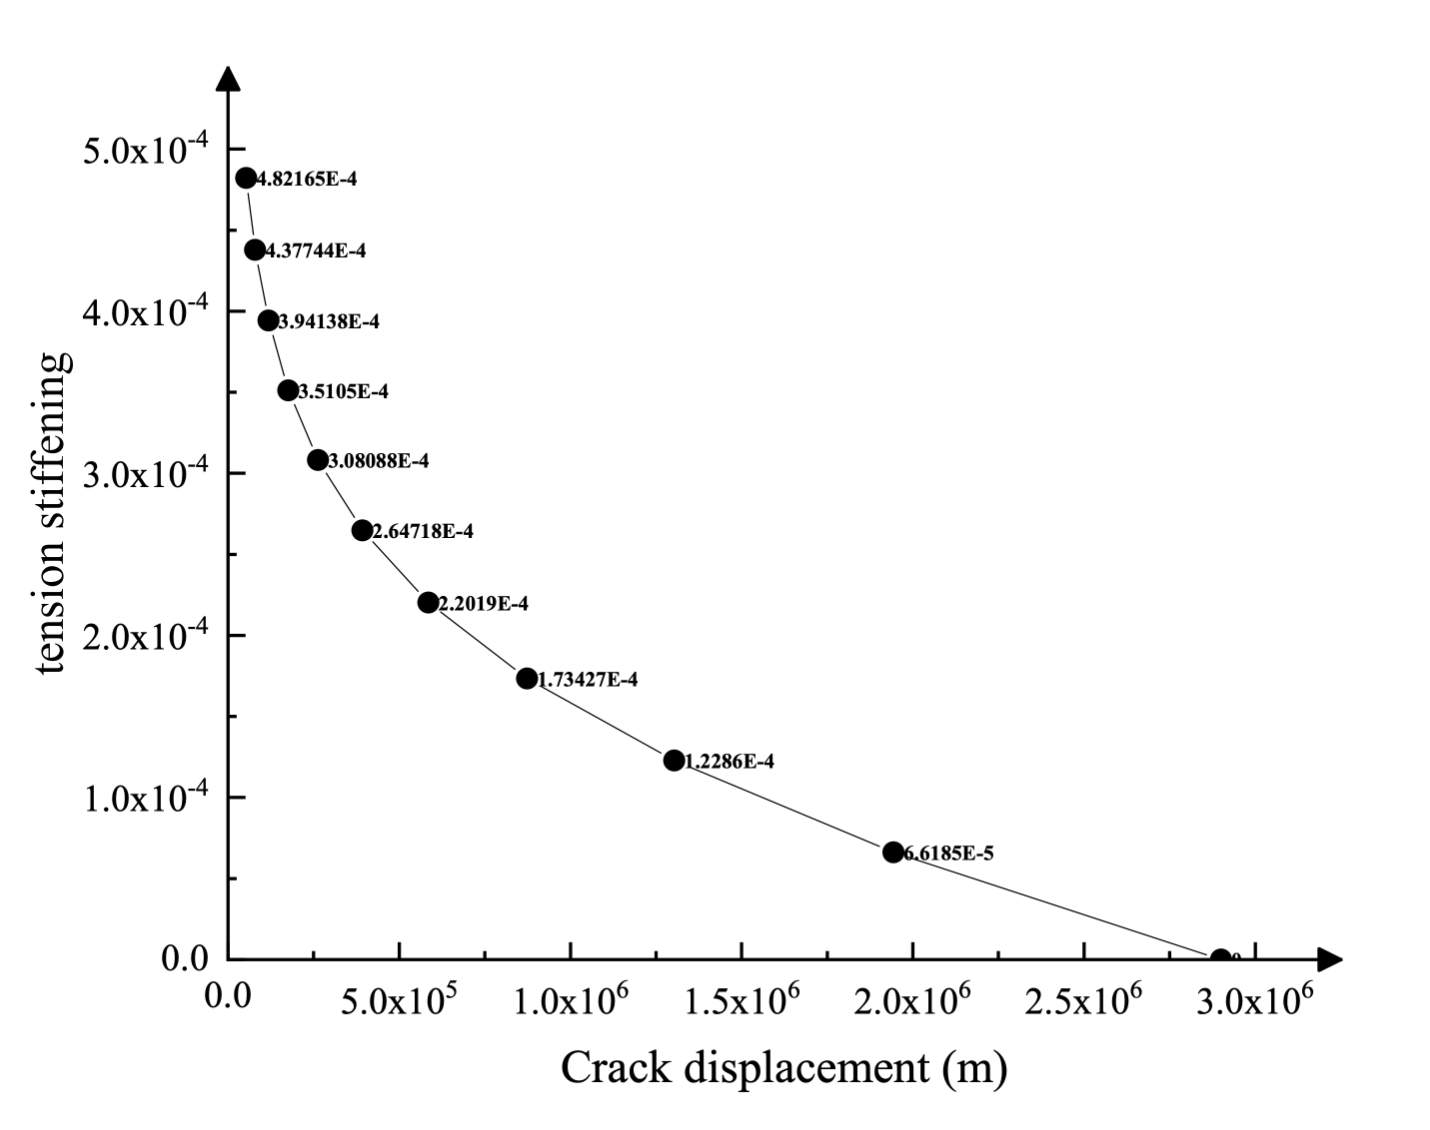
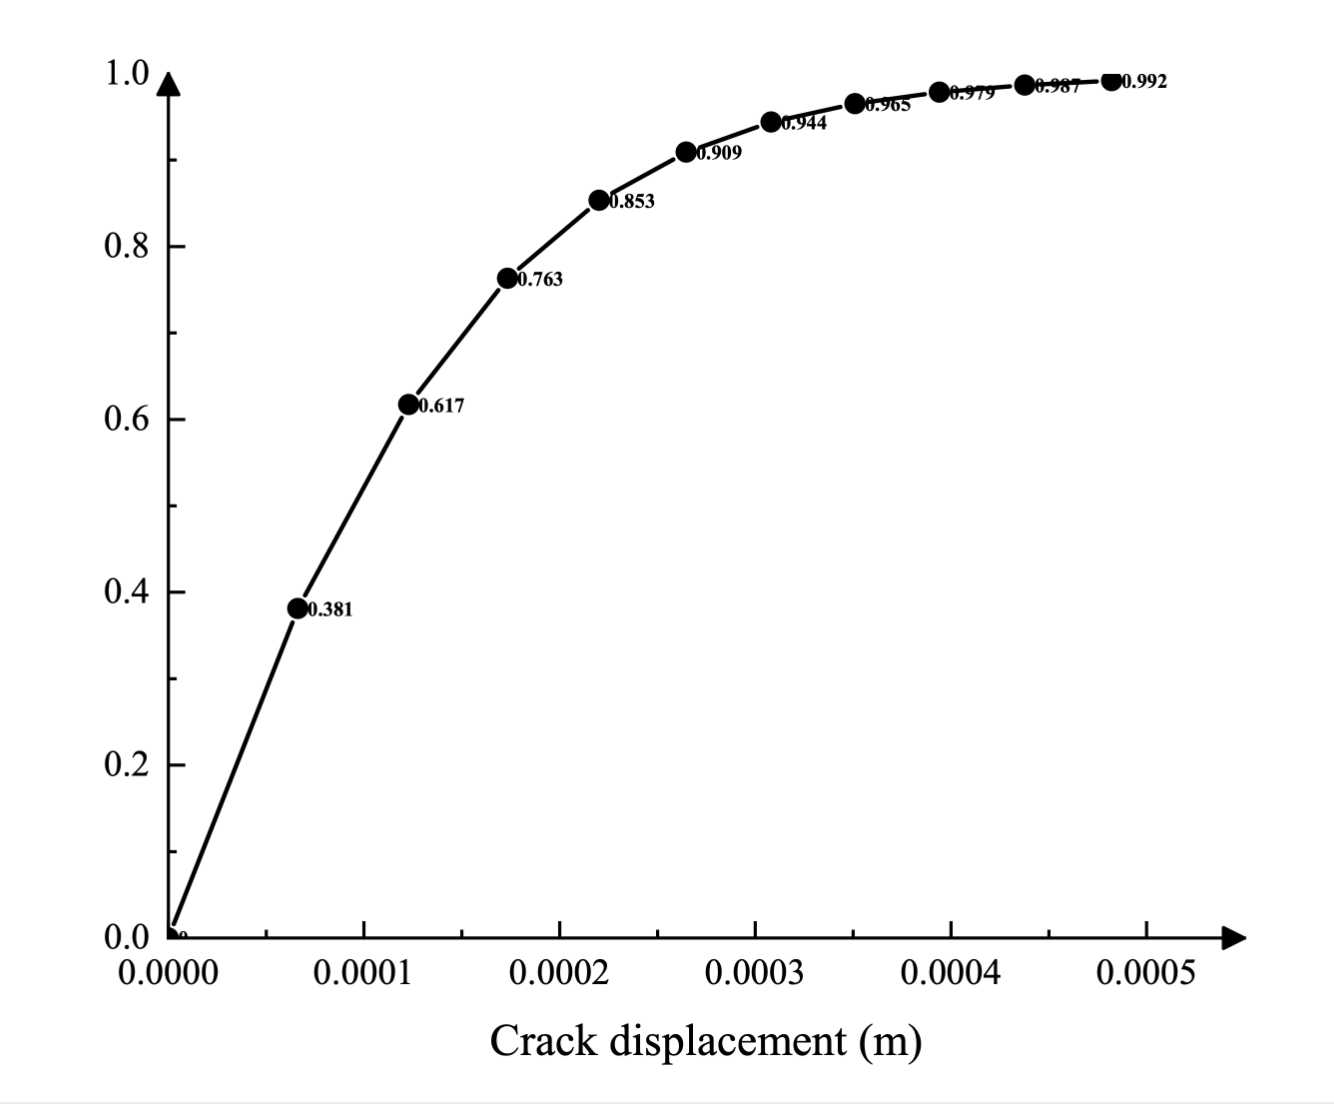
Likewise, tensile damage is specified in tabular form as a function of crack displacement using the post-crack damage-displacement curve shown in Figure 4.2. Stiffness degradation damage due to compressive failure (crushing) of concrete is assumed to be zero.
Case 1: Frequency domain analysis
Concrete dam frequency analysis is of great significance in water conservancy projects, mainly in the following aspects:
1. Seismic performance assessment
High concrete dams are usually located in earthquake-prone areas, and seismic performance is the key to their safe operation. Through frequency analysis, we can understand the dynamic response characteristics of the dam under earthquake action and evaluate its seismic resistance. For example, frequency analysis can help determine the natural frequency and mode shape of the dam under earthquake action, thereby evaluating its seismic performance3.
2. Dynamic Characteristics Analysis
Frequency analysis can reveal the dynamic characteristics of the dam, including natural frequency, vibration mode and damping ratio. These dynamic characteristics are crucial to understanding the dynamic response and behavior of the dam. For example, frequency analysis can be used to understand the changes in the natural frequency of the dam under different water levels and load conditions, thereby evaluating its dynamic stability.
- The following figure shows the first 4 vibration modes of Koyna
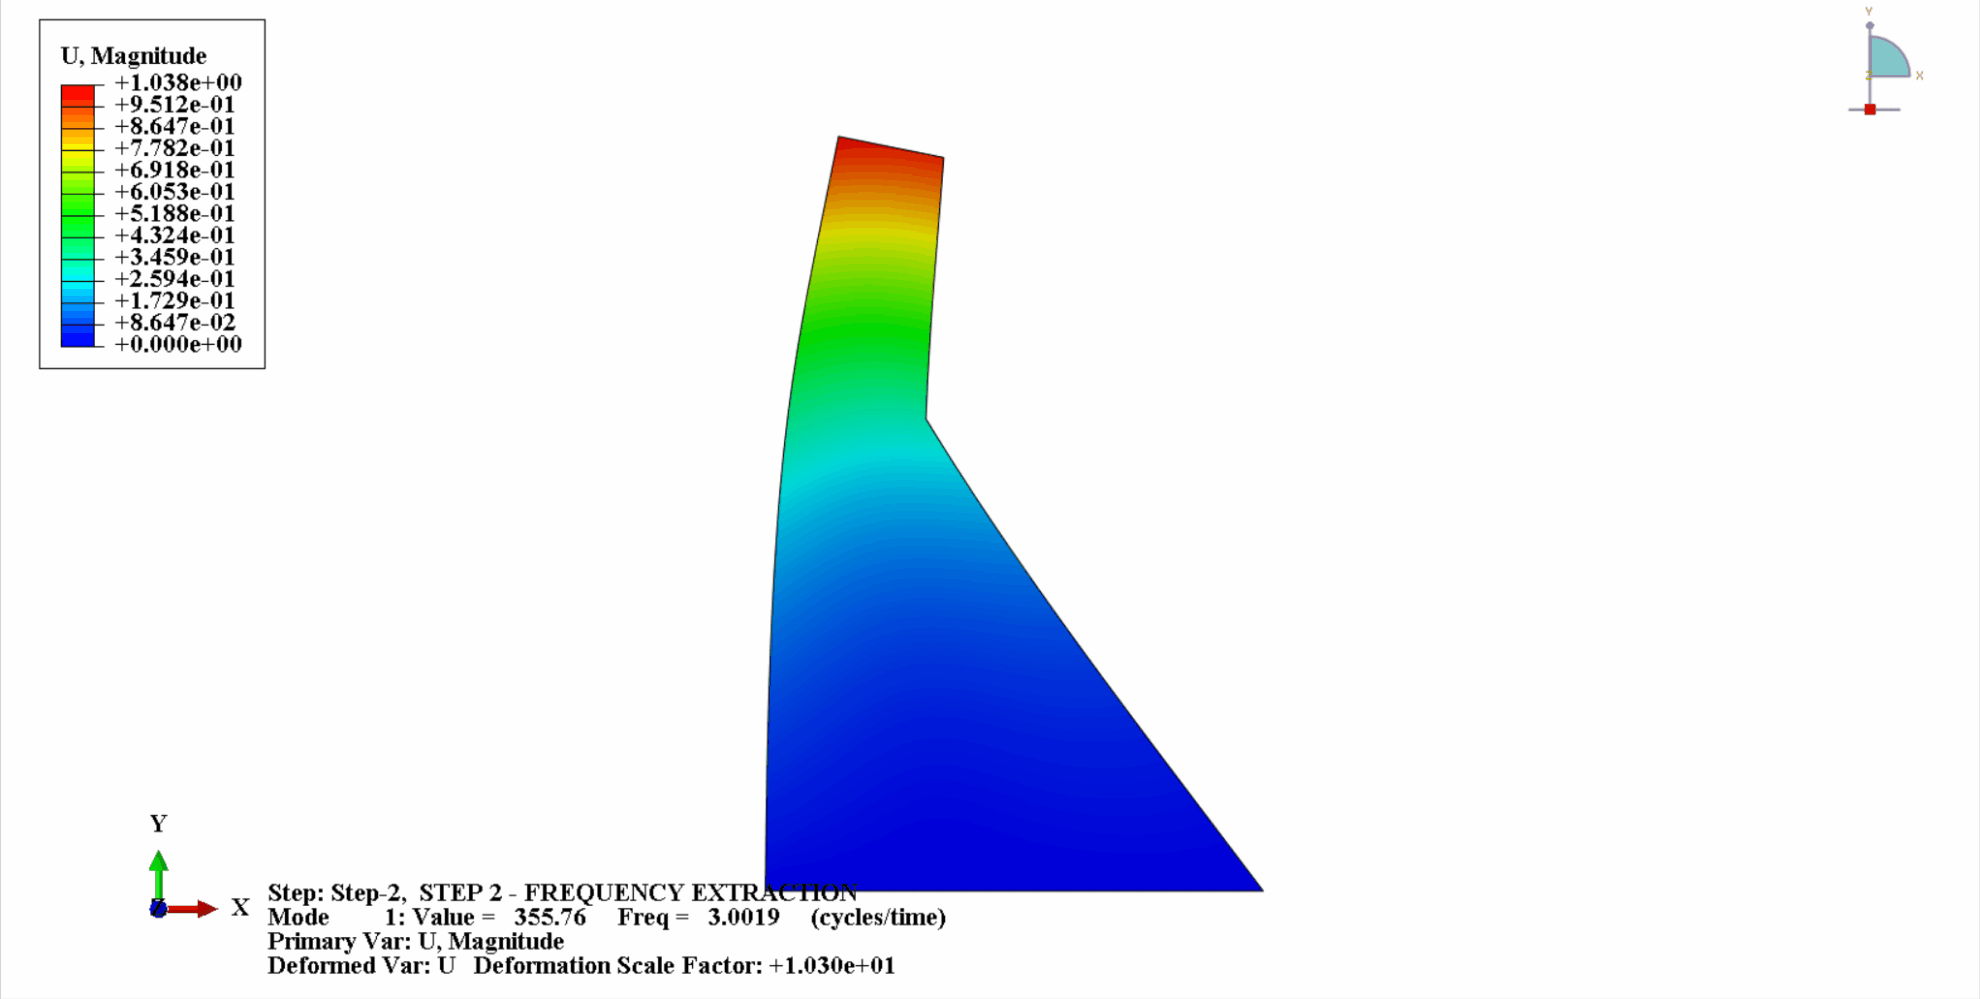
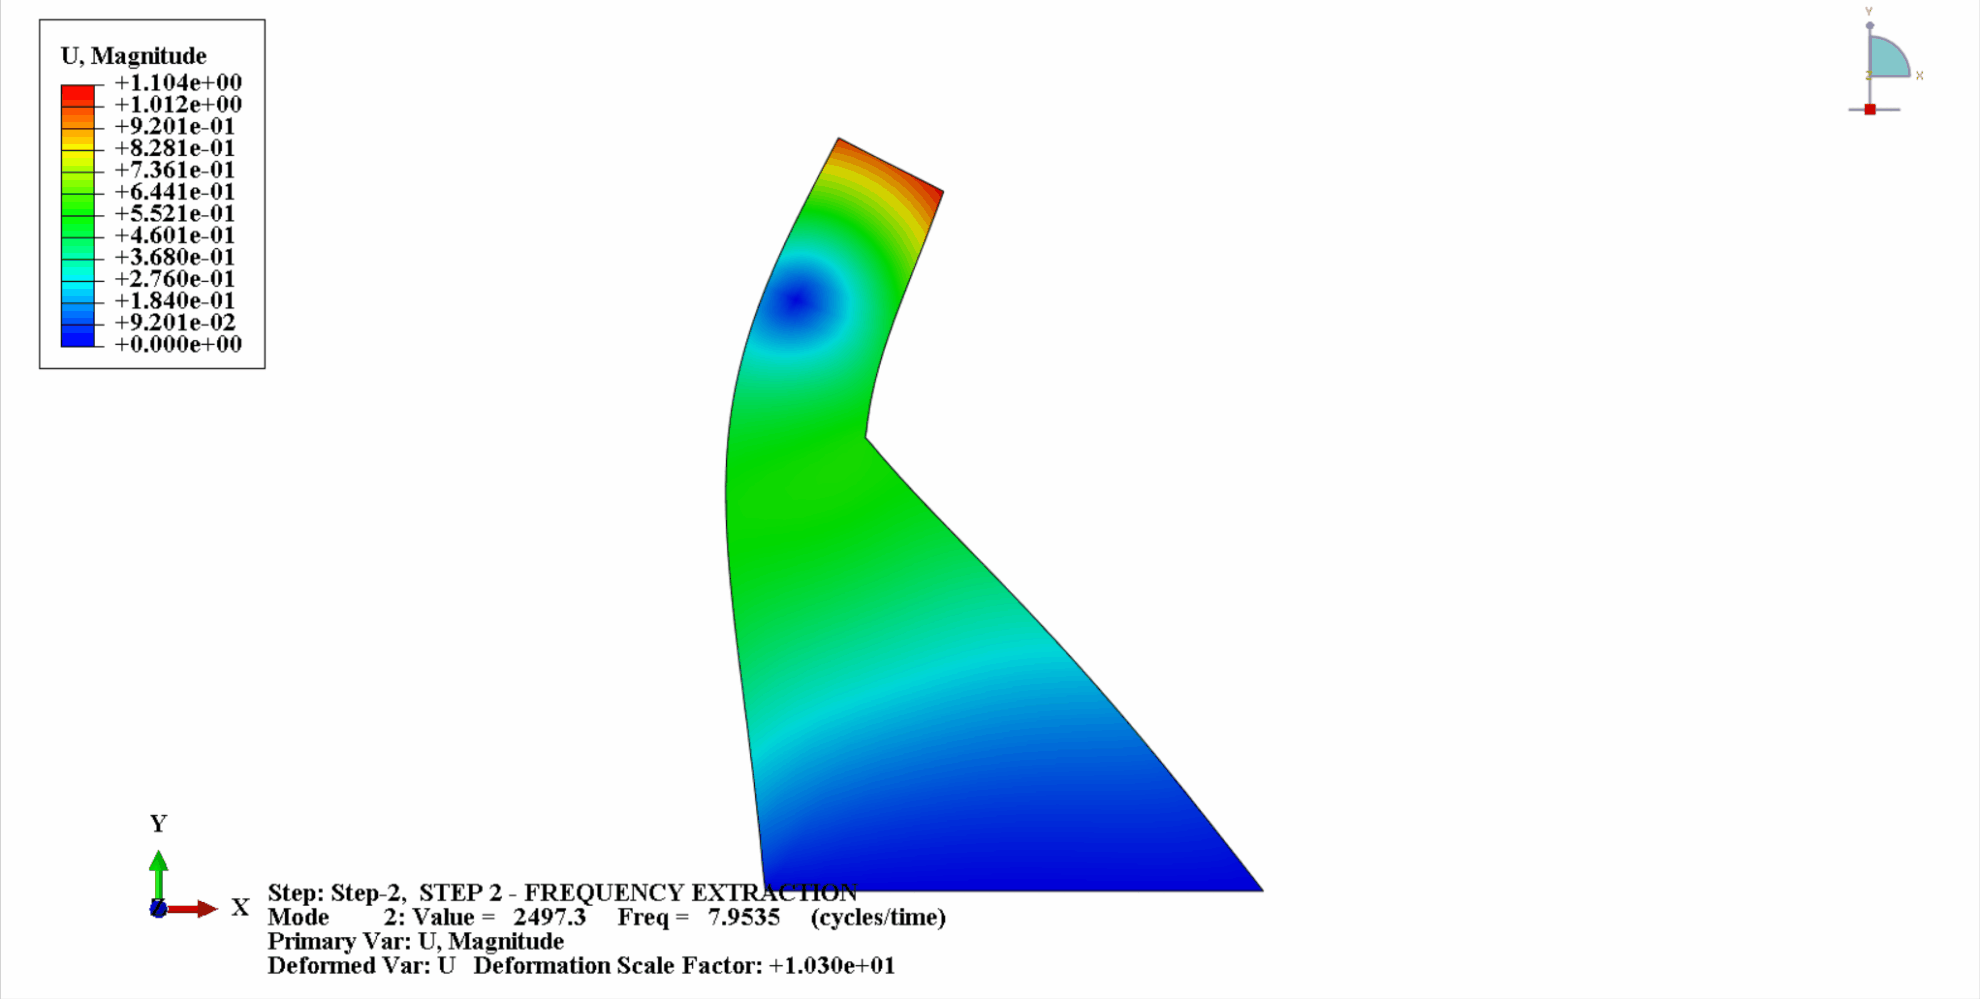
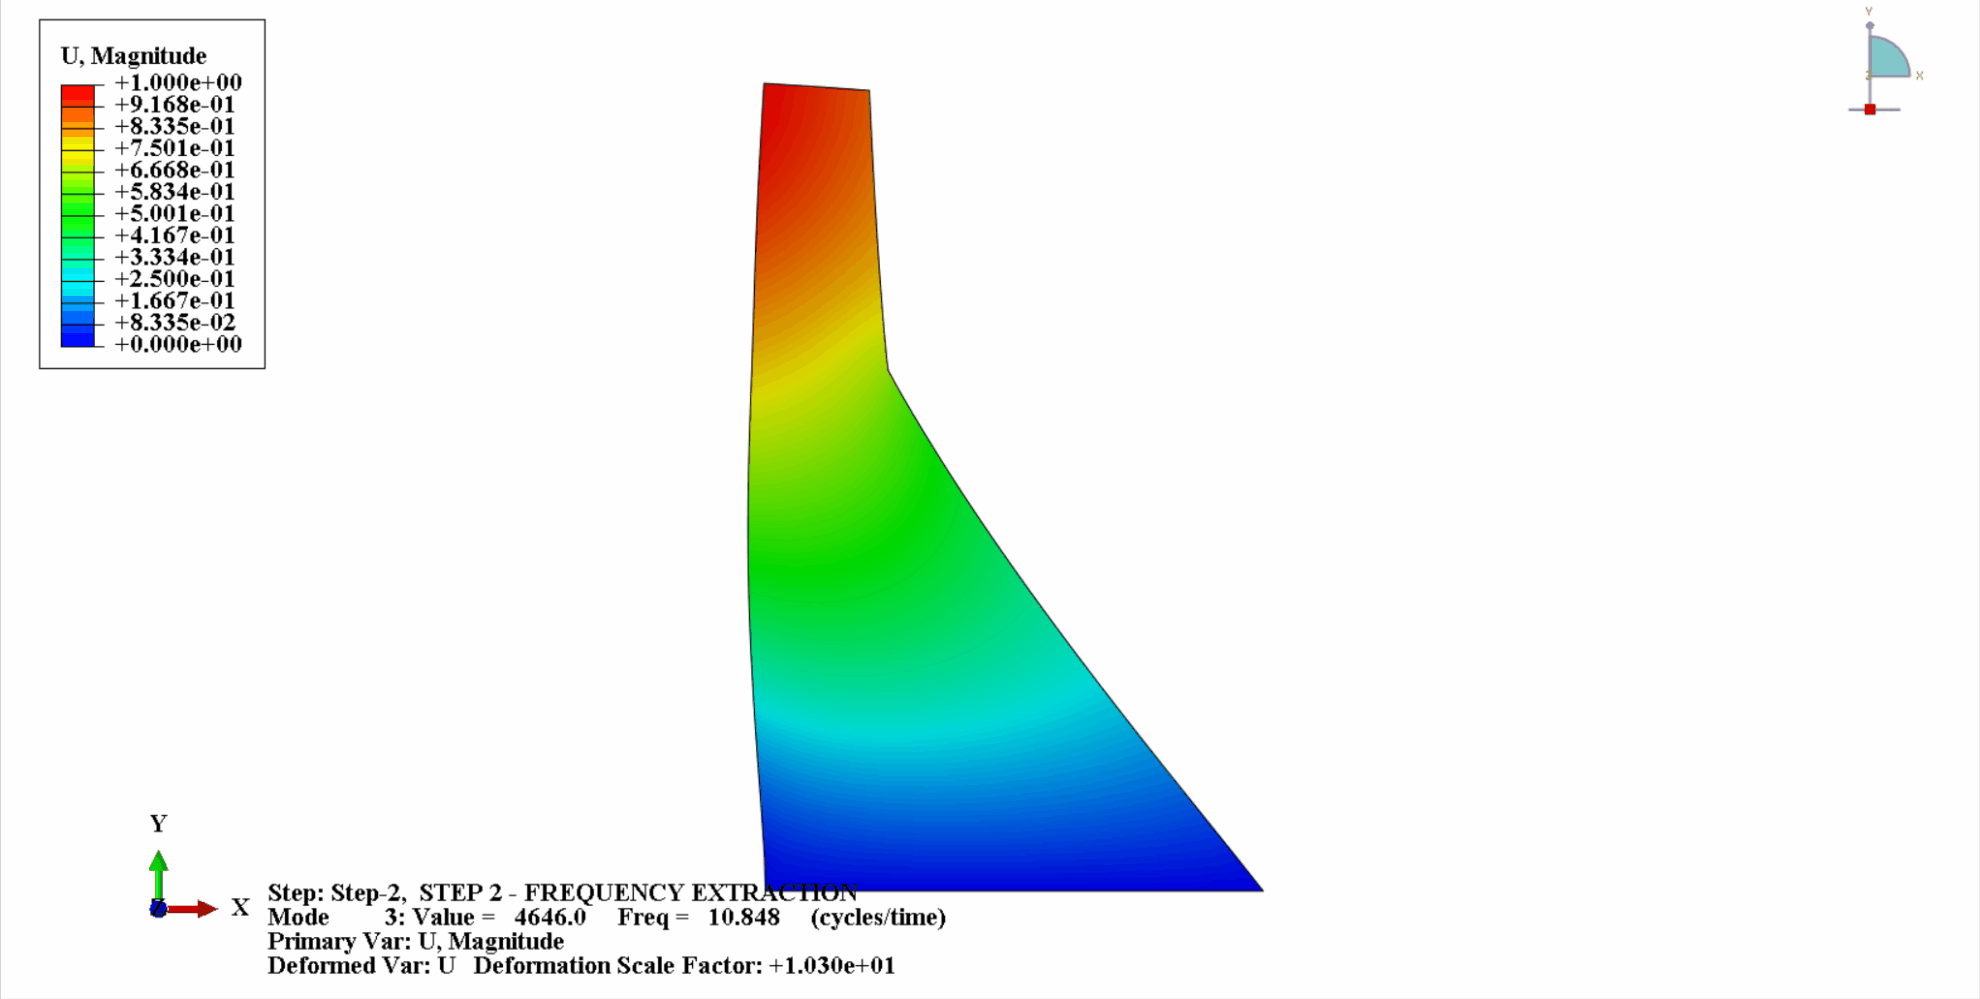
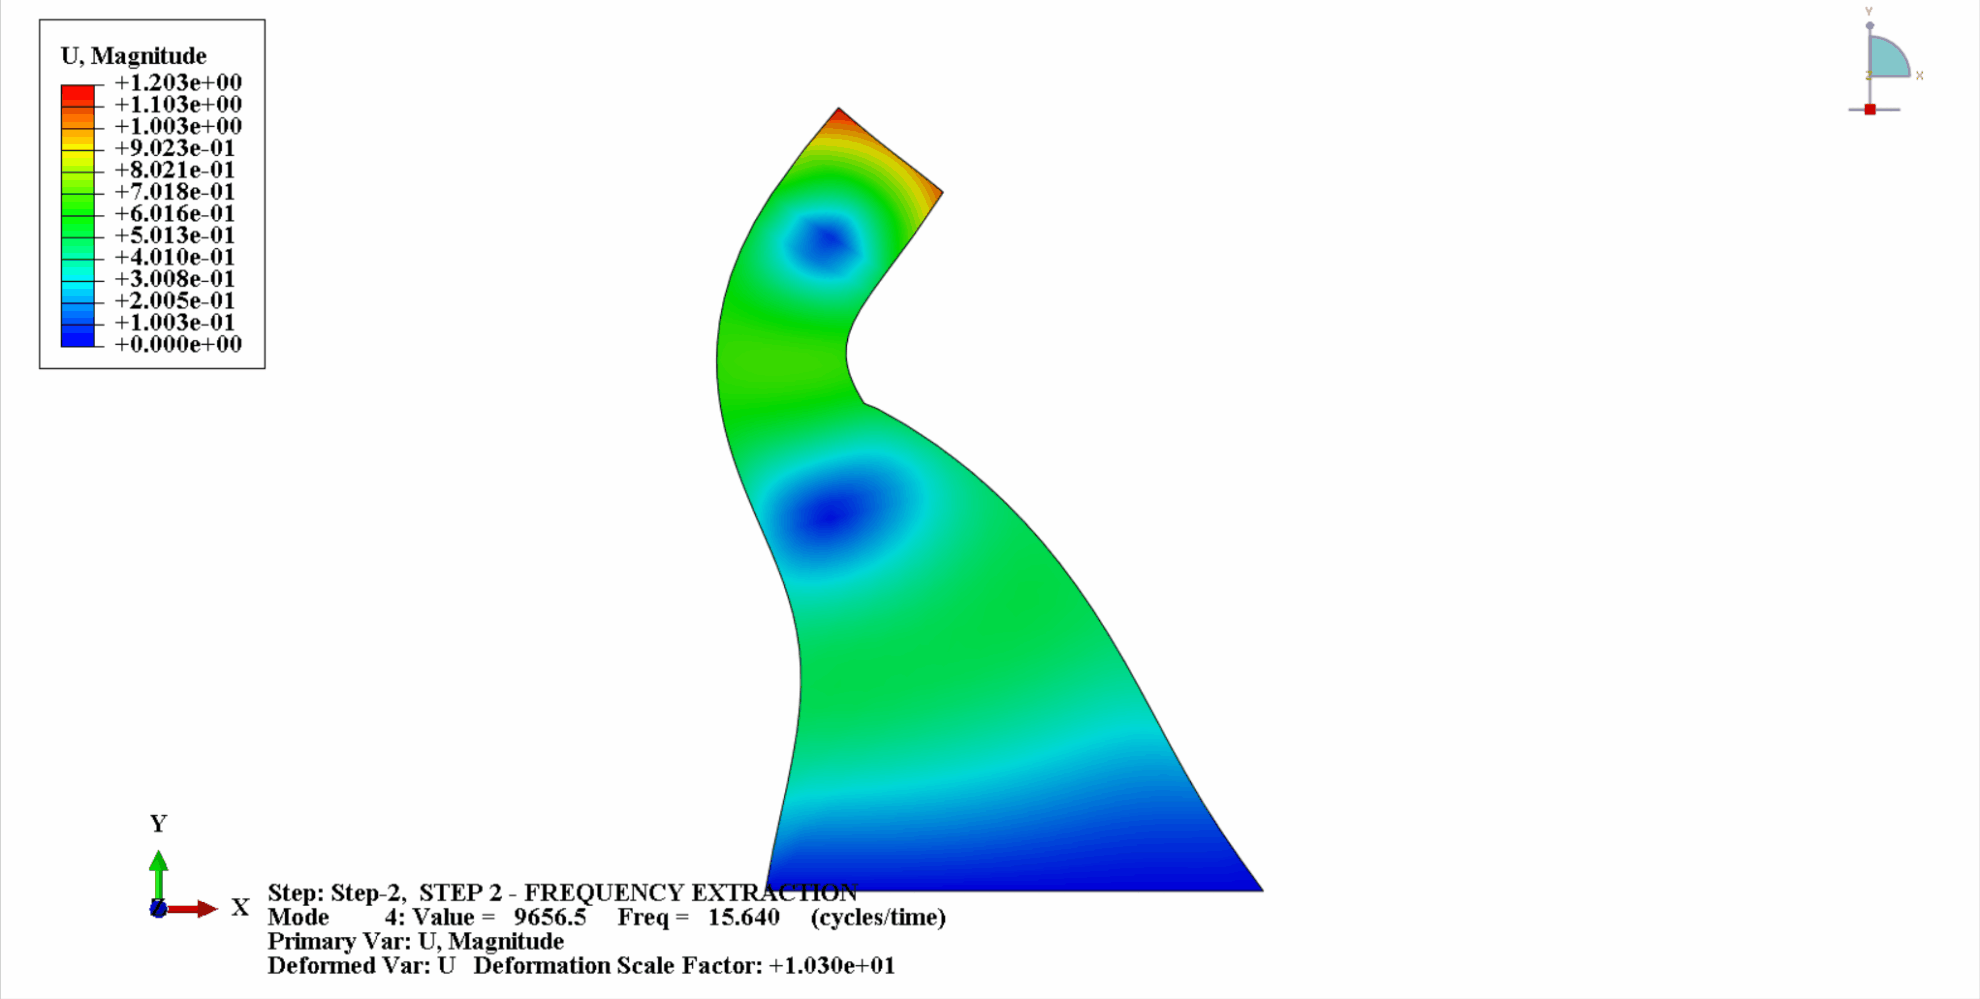
- The following table shows the comparison of natural frequencies: It can be seen that the calculation results in this example are consistent with Chopra's calculations, and the calculation error is within an acceptable range.
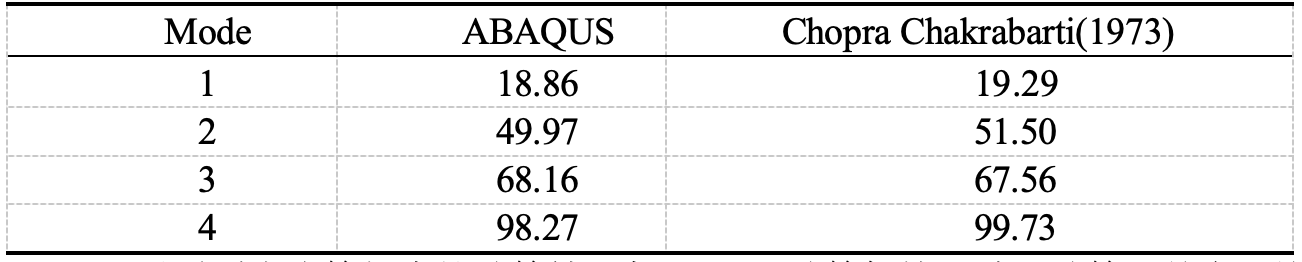
It can be seen that the calculation results in this example are consistent with Chopra's calculation, and the calculation error is within an acceptable range.
Case 3: Seismic response analysis - considering hydrodynamic pressure
In the seismic response analysis of concrete dams, the main focus is on the relative data between the dam crest and the dam bell, such as relative displacement data, relative velocity and relative acceleration data.
* Below is the time history curve of relative displacement of dam crest and dam bell along the river:
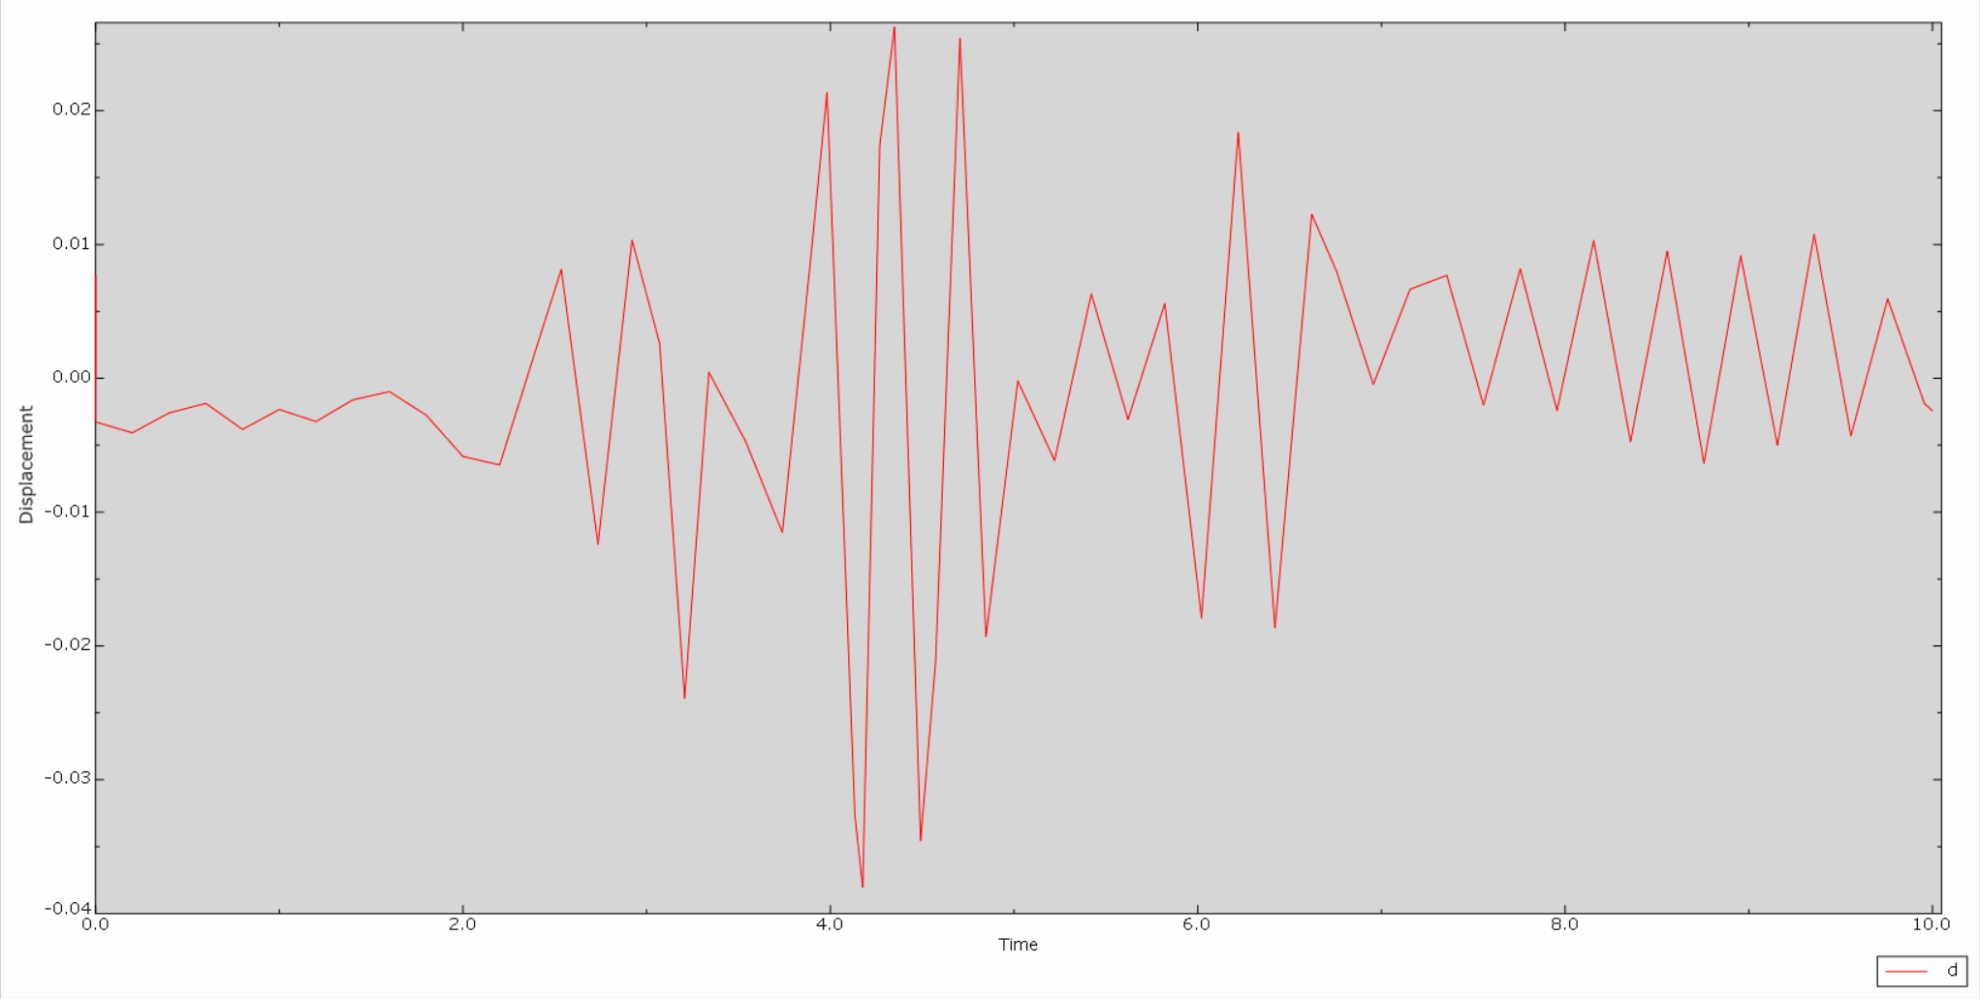
*Then is the relative velocity time history curve of dam crest and dam bell:
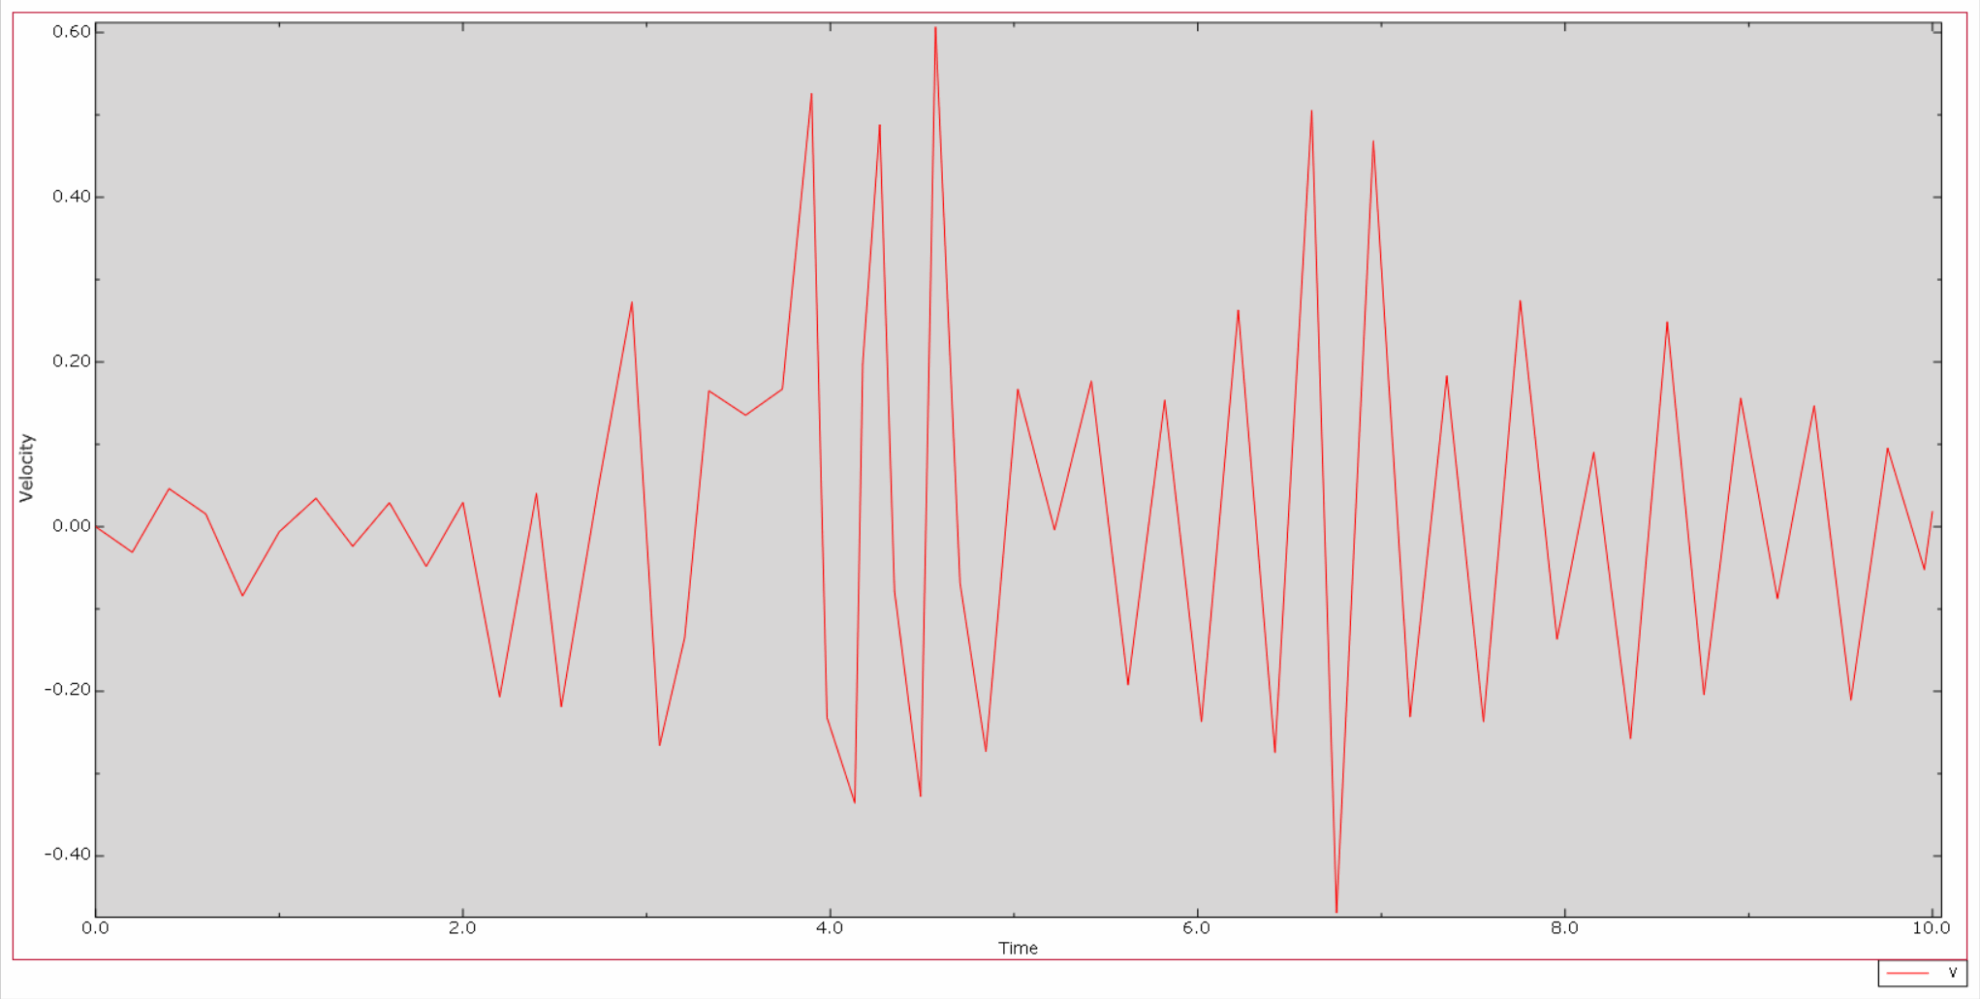
*Then is the relative acceleration time history curve of dam crest and dam bell:
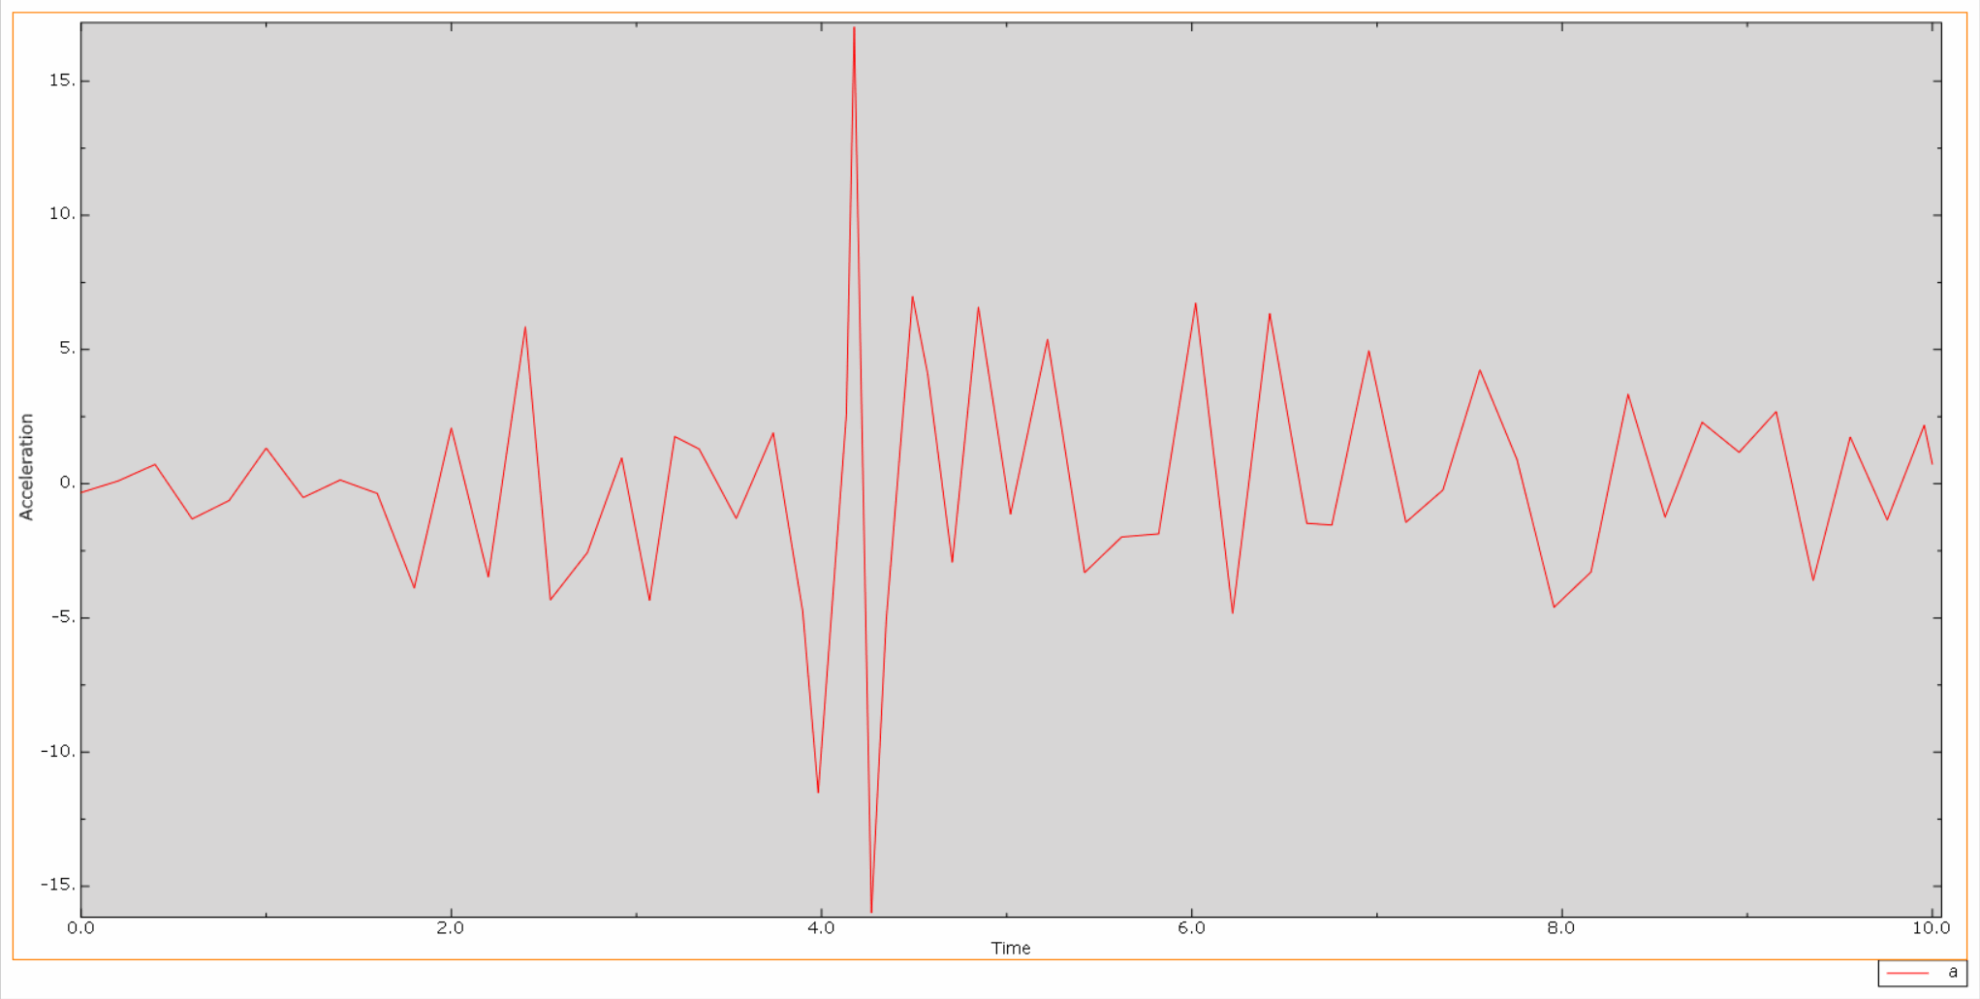
Under the action of an earthquake, the material of the concrete dam is in a cyclic tension-compression state, and the concrete will be damaged. The following is a cloud diagram of the tensile damage of the dam body at different times.
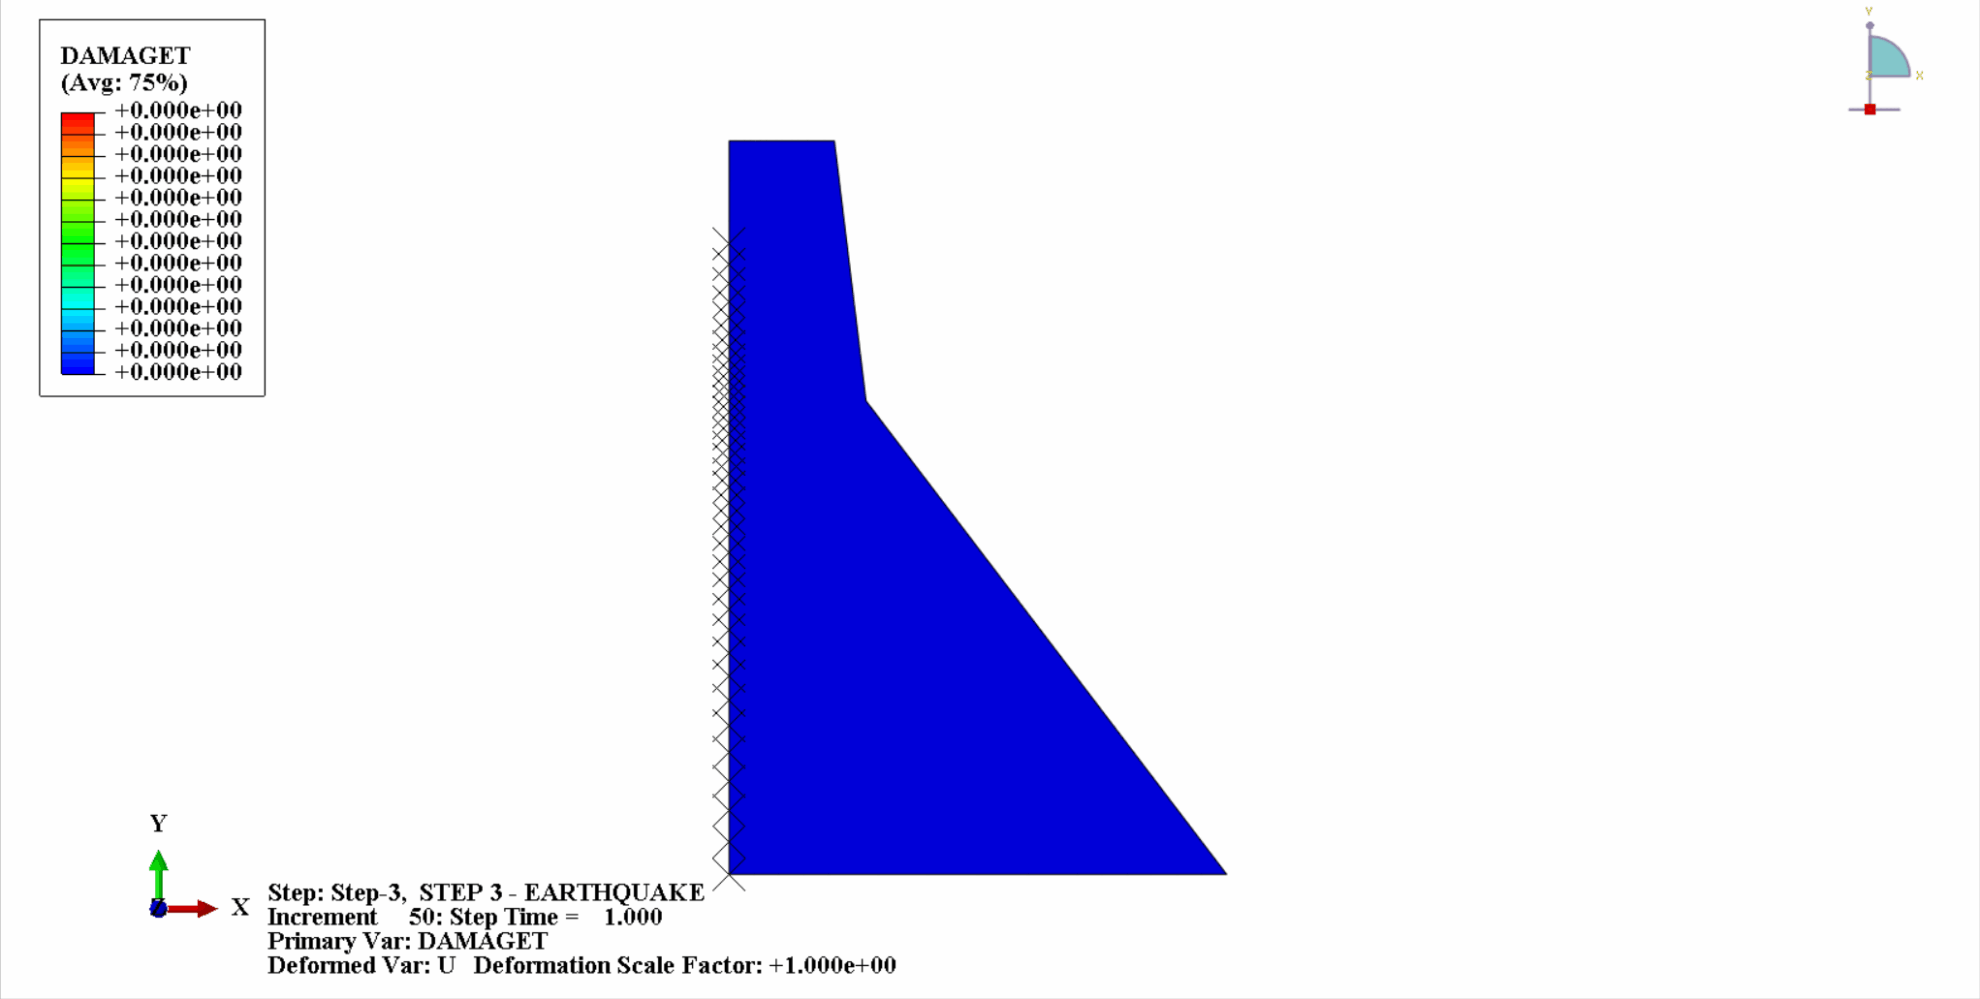
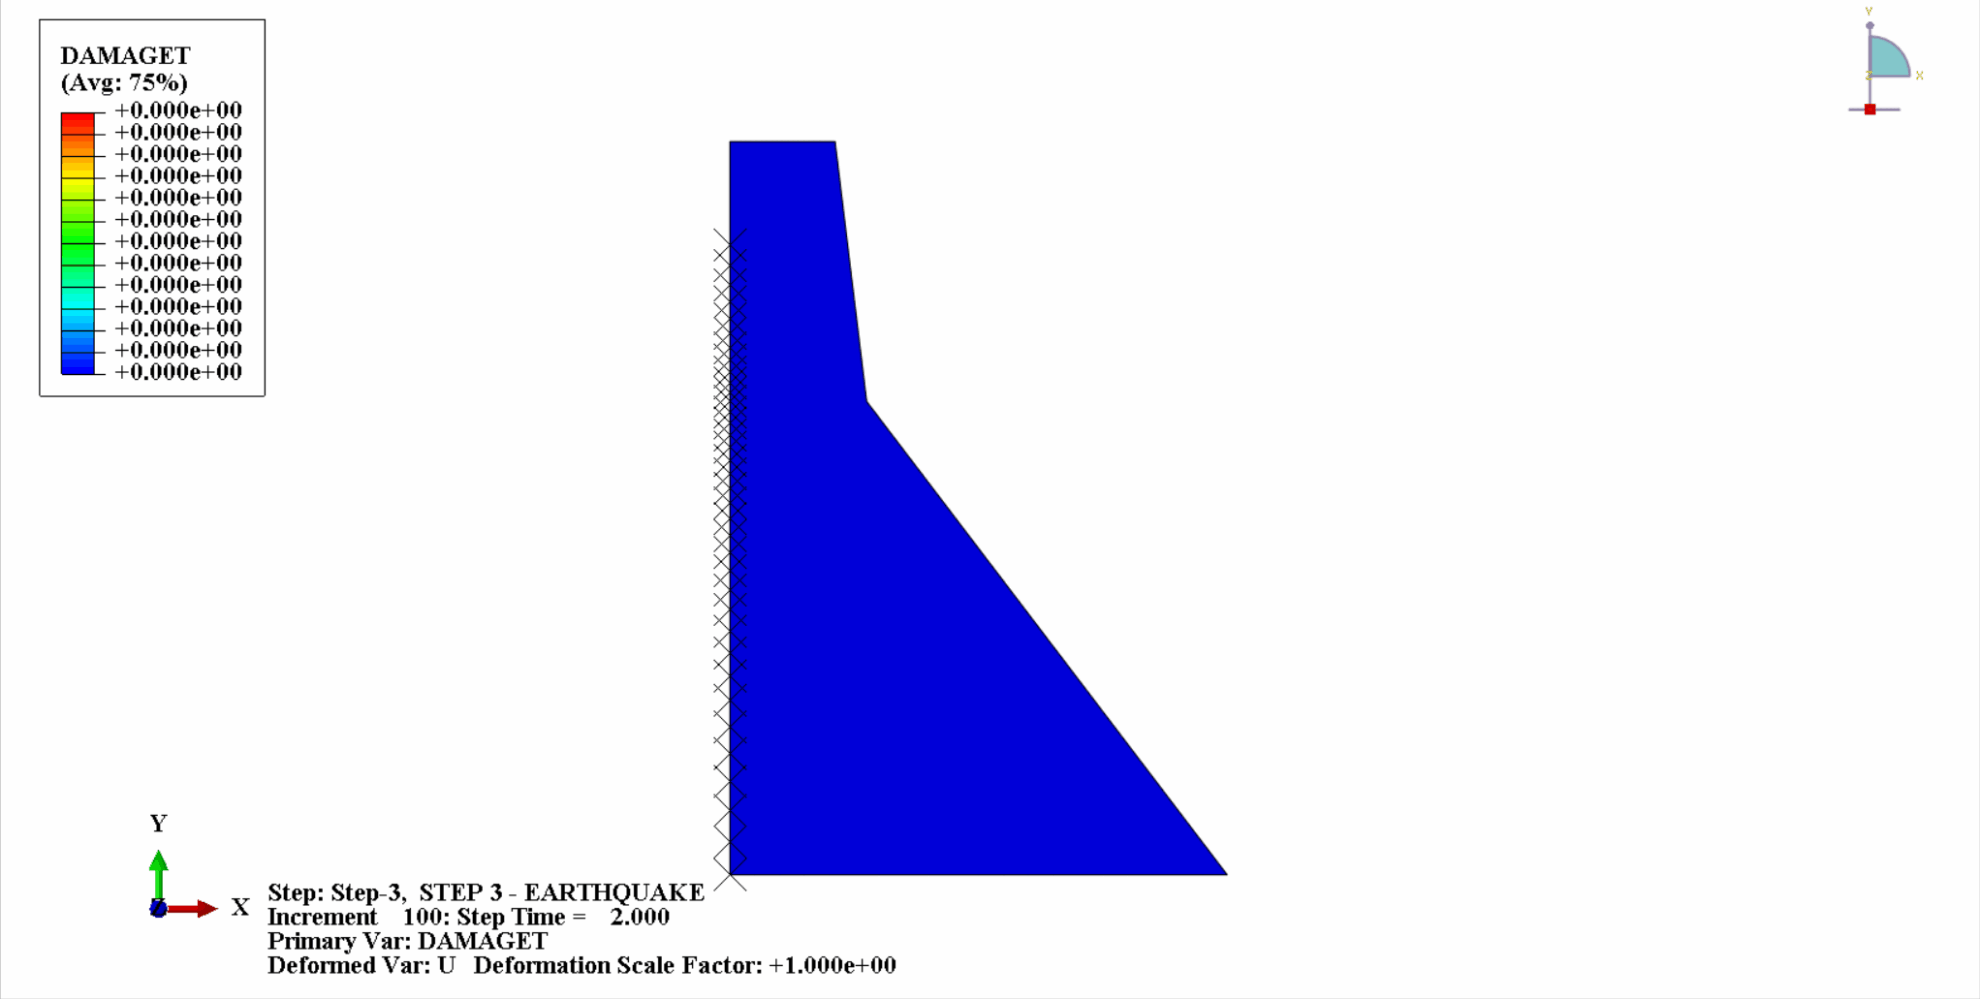
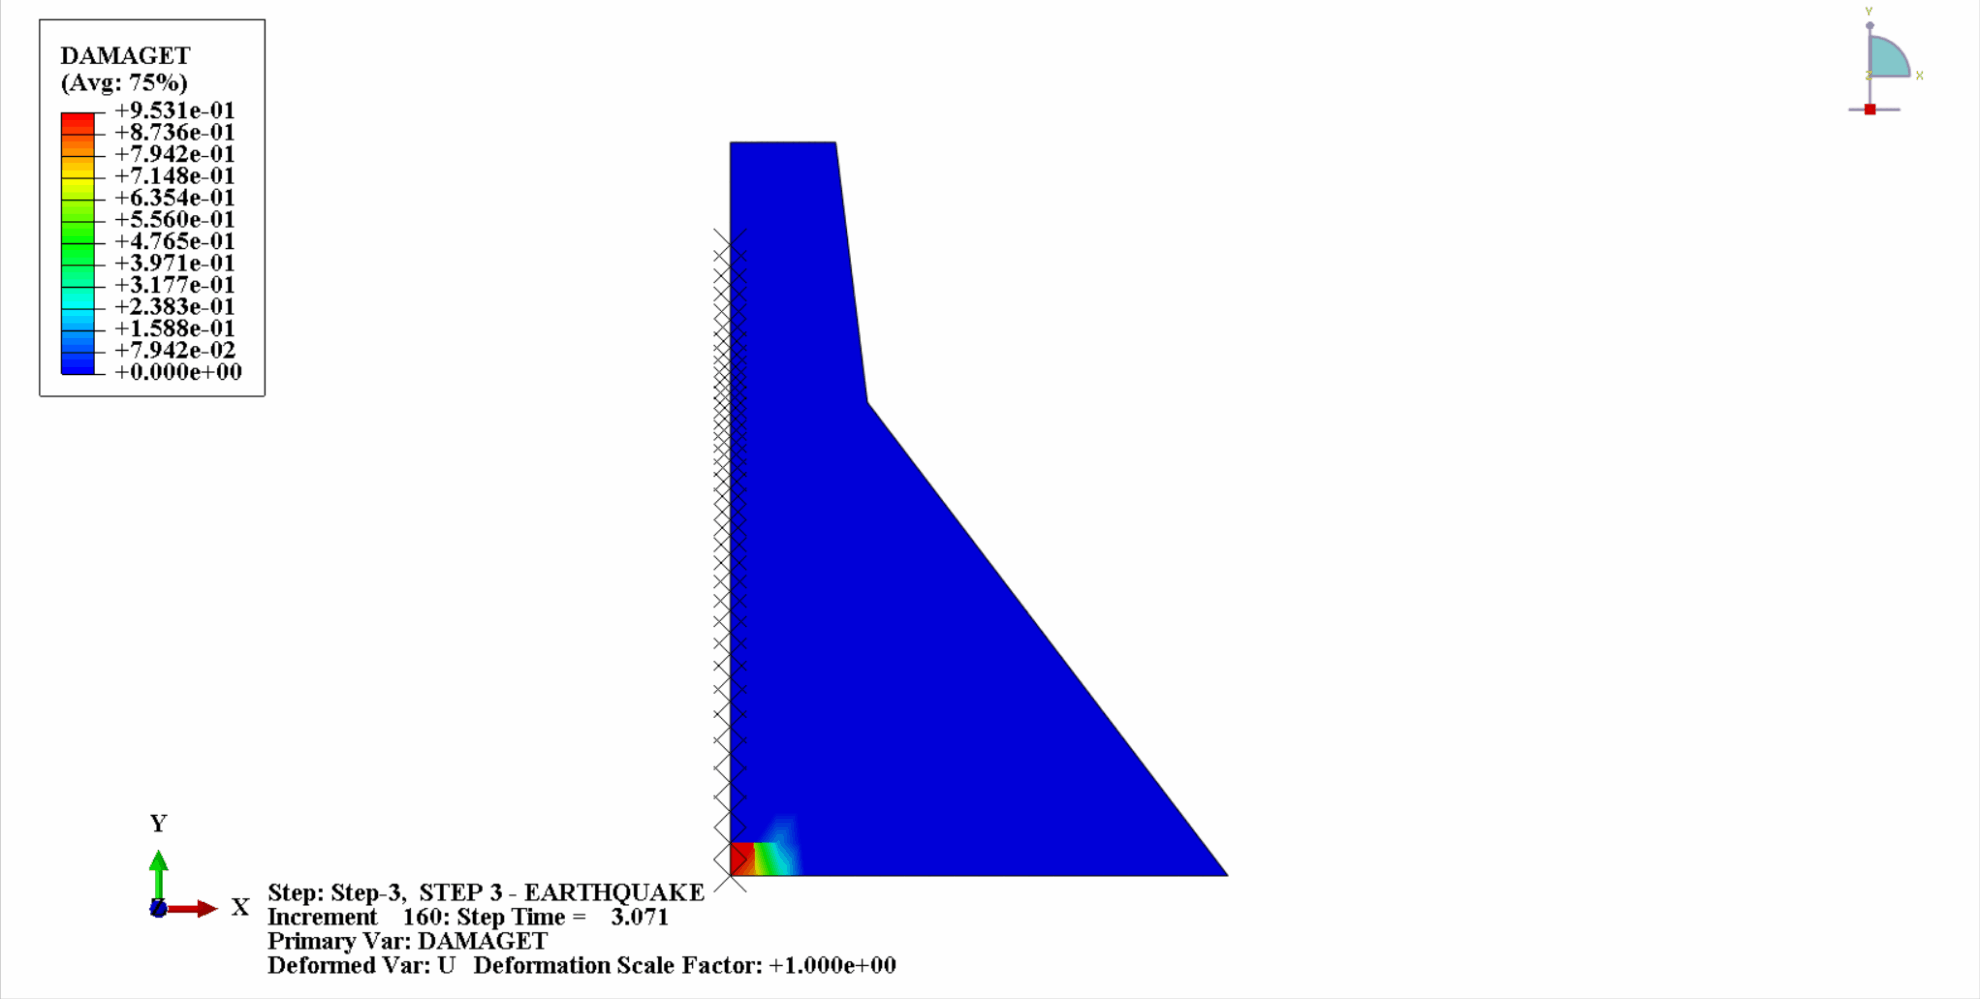
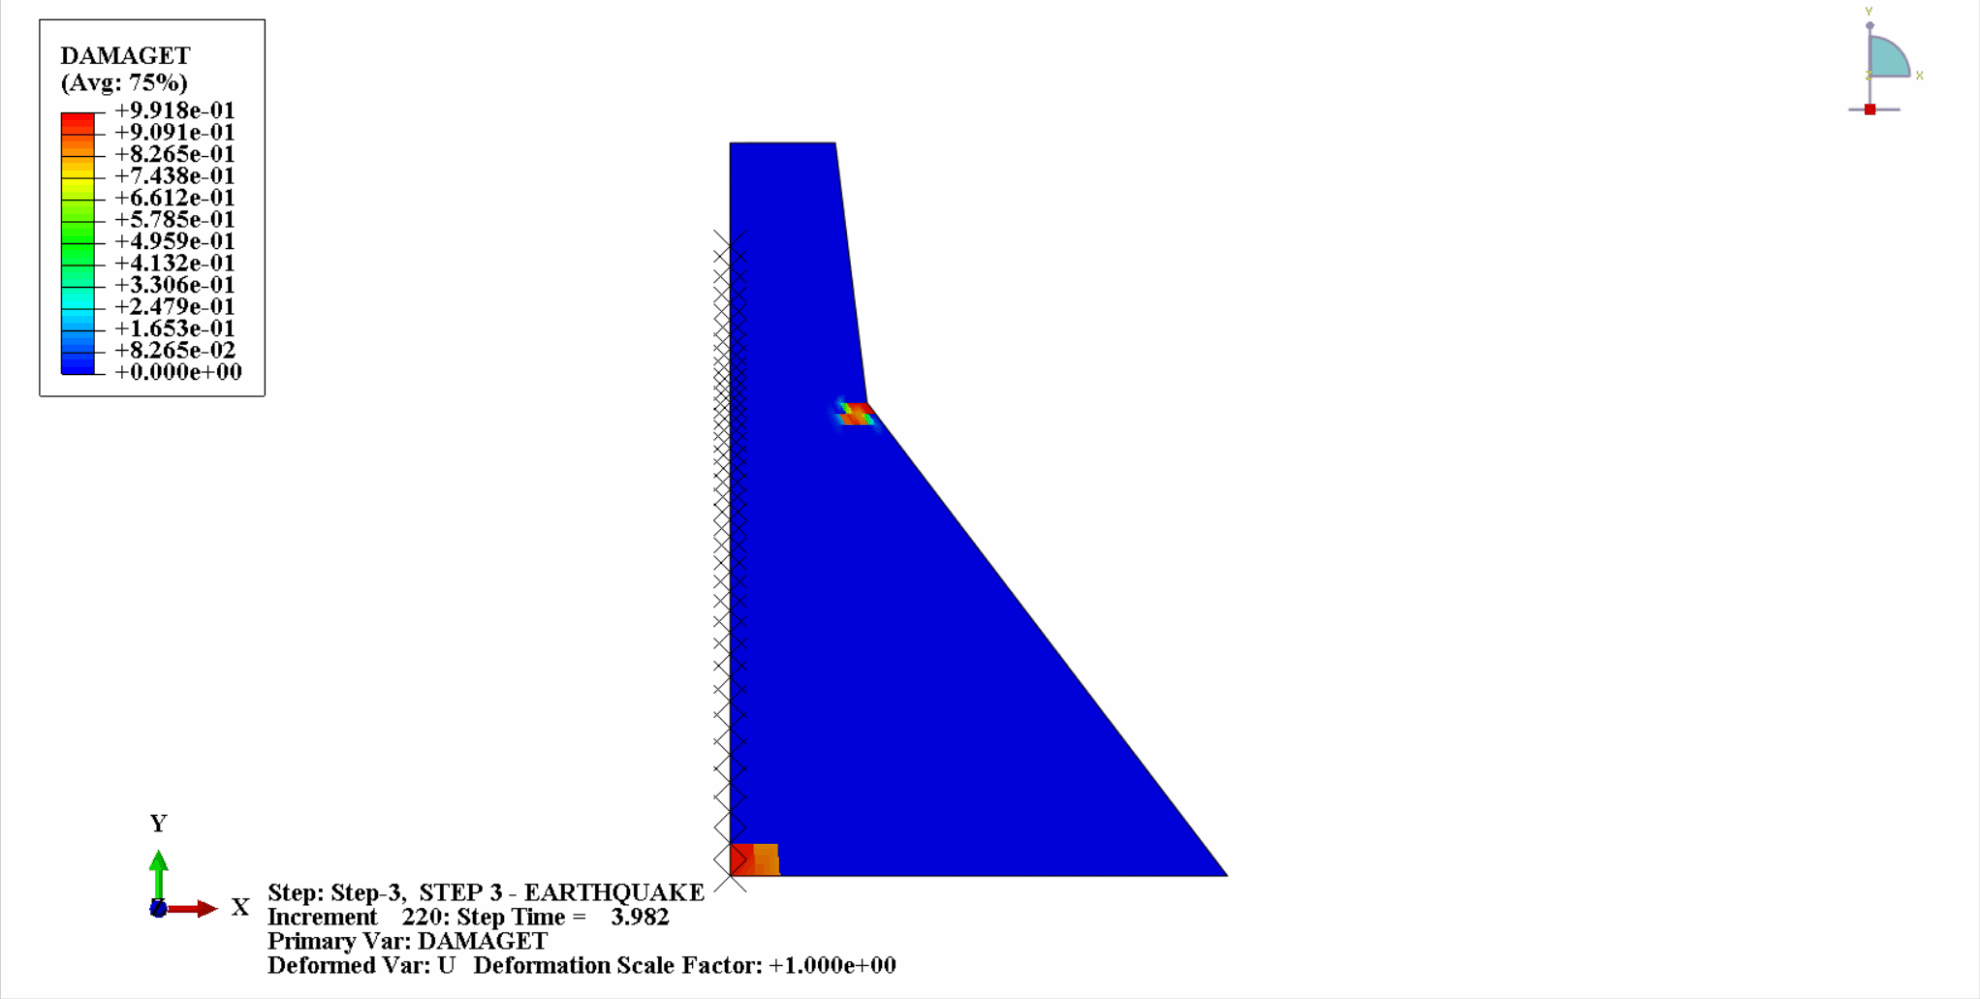


It can be seen that with the increase of time, the tensile damage of the dam concrete gradually accumulates. At the last moment of the earthquake, the damage reaches the maximum. The tensile damage area of the concrete dam is mainly concentrated in the dam center and the upstream and downstream fold slopes of the dam body.
Build AI with AI
From idea to launch — accelerate your AI development with free AI co-coding, out-of-the-box environment and best price of GPUs.