Command Palette
Search for a command to run...
Data denoising/biological Signal enhancement/dropout Alleviation, Deep Learning Model SUICA Achieves Prediction of Gene Expression at Any Position in Spatial Transcriptome Slices
The group of Professor Zheng Yinqiang from the University of Tokyo and the group of Professor Ding Jun from McGill University jointly proposed a method for modeling spatial transcriptome data, SUICA. SUICA is a deep learning model based on implicit neural representations (INR) and graph autoencoders. SUICA uses graph autoencoders to reduce the dimensionality of high-dimensional spatial transcriptome data, and then uses implicit neural representations to model the coordinates of spatial transcriptome data and their corresponding gene expressions, thereby achieving the prediction of gene expression at any position in the spatial transcriptome slice.The results show that spatial transcriptome data processed by SUICA can have higher quality, lower noise and stronger biological signals.
The related results were selected for ICML 2025 under the title "SUICA: Learning Super-high Dimensional Sparse Implicit Neural Representations for Spatial Transcriptomics".
Paper address:
https://go.hyper.ai/C6Zcl
focus on 「HyperAI "WeChat official account, reply "SUICA" in the backstage to get the complete PDF
More AI frontier papers:
https://go.hyper.ai/owxf6
What is spatial transcriptome data?
Spatial transcriptomics (ST) data is a high-dimensional information matrix that simultaneously records "gene expression levels" and "spatial coordinates" on the same tissue section.Compared with traditional panoramic tissue imaging (WSI) that can only present morphological structures or conventional transcriptomics that can only quantify gene expression but lose direction, spatial transcriptomics binds "which genes are expressed" with "where they are located in the tissue", drawing a functional map of the interaction between cell status and microenvironment in the tissue, thus becoming a new data form that connects histology and molecular omics.
Why is there a need to enhance spatial transcriptomic data?
Although spatial transcriptomics has brought unprecedented spatially resolved molecular insights, real-world data are still limited by three major bottlenecks:
① Resolution-cost contradiction:The denser the probes and the higher the sequencing depth, the faster the experimental cost (e.g., the sequencing experiment cost of stereo-seq is greater than $4,000/cm²) and the sample throughput increase;
② Signal sparseness and noise:The number of mRNAs captured at each detection point is limited, and zero expansion is serious, which makes it easy for low-abundance or key regulatory genes to be missed;
③ Cross-platform heterogeneity:Different platforms have significant differences in probe physical arrangement, sequencing depth and background noise, which directly hinders the integration of multiple samples or multiple experiments.
Computational enhancement methods include super-resolution reconstruction, deep denoising, and missing value filling, which can do the following without increasing (or only slightly increasing) the experimental cost:
(a) Predicting gene expression at sites that have not been sequenced;
(b) Recover the true gene expression that cannot be detected due to technical limitations and improve the sensitivity of detecting differentially expressed genes and spatially variable genes;
(c) Generate standardized feature representations that are comparable and shareable across different platforms.
This will provide a more accurate, rich and scalable data foundation for cell communication analysis, disease zoning annotation, drug target discovery, multi-omics joint modeling and AI pathology-assisted diagnosis, greatly unleashing the potential of spatial transcriptomics technology in basic research and clinical transformation.
SUICA: A unified model based on implicit neural representation and graph autoencoder
Challenges of modeling spatial transcriptomic data using implicit neural representations
Modeling spatial transcriptomic data faces multiple challenges:
First, the original data is distributed in a grid-like manner in the spatial dimension.In terms of gene dimension, the number is as high as thousands to tens of thousands, forming an "ultra-high-dimensional, extremely sparse, and noisy" matrix; the high dropout rate weakens the key biological signals, exacerbating the lack of statistical power.
Second, existing spatial transcriptomics platforms have a fundamental trade-off between resolution and cost.——The denser the probes and the deeper the sequencing, the cost will rise exponentially, making it difficult to achieve both cellular-level resolution and large-scale sample sizes at the same time.
Thirdly, when trying to use implicit neural representation to interpolate discrete spatial transcriptome points into continuous expression fields, two major technical difficulties need to be solved at the same time: first, the dimension of the gene expression space far exceeds that of traditional visual signals, and simply widening or deepening the network is difficult to get rid of the dimensionality curse; second, zero expansion leads to highly uneven distribution of input signals, and conventional INRs are difficult to capture complex and nonlinear spatial expression patterns.
Figure Autoencoder: Reducing the dimensionality of transcriptome data in high-dimensional space
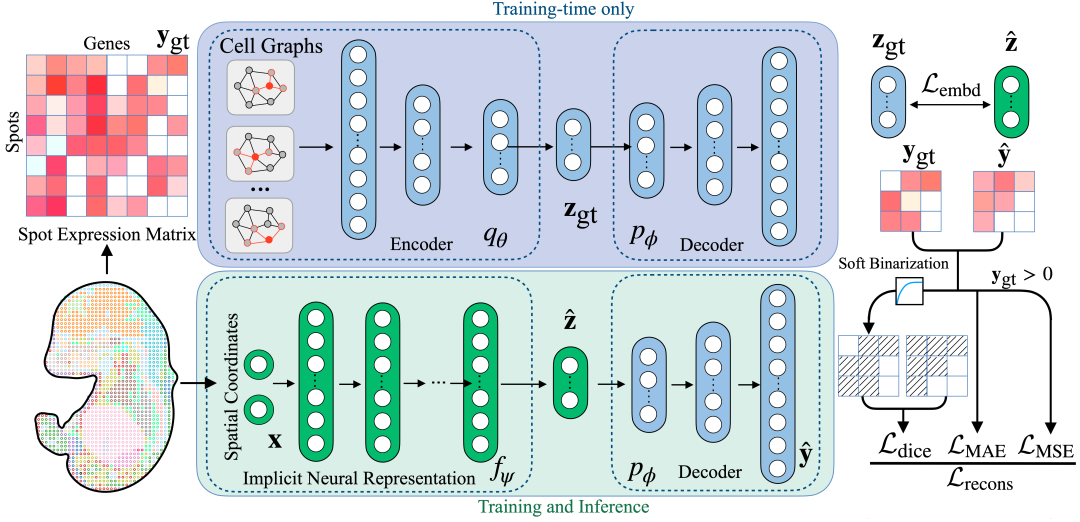
Compared with traditional autoencoders, we first regard the data points in each spatial transcriptome as graph nodes and construct an adjacency matrix based on spatial proximity. Then, we use graph convolution in the encoder to convolve the original high-dimensional gene expression, incorporate the local spatial context into the representation and compress it into a low-dimensional representation. In this way, we learn the low-dimensional representation of high-dimensional spatial transcriptome data, and the addition of graph convolution can enhance the sparse and noisy spatial transcriptome data signal.
Implicit neural representation: establishing a mapping between sequencing point coordinates and gene expression
After obtaining the low-dimensional representation,The implicit neural representation network receives the coordinates of the detection points as input and learns the mapping between the "point" and its corresponding low-dimensional representation.And the learned, model-predicted low-dimensional representation is sent to the decoder part of the graph autoencoder, thereby achieving the function of mapping coordinates to high-dimensional gene expression.
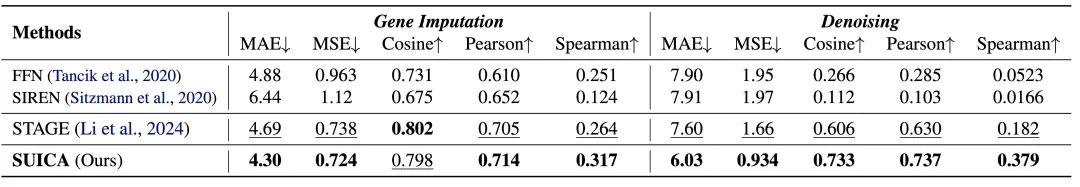
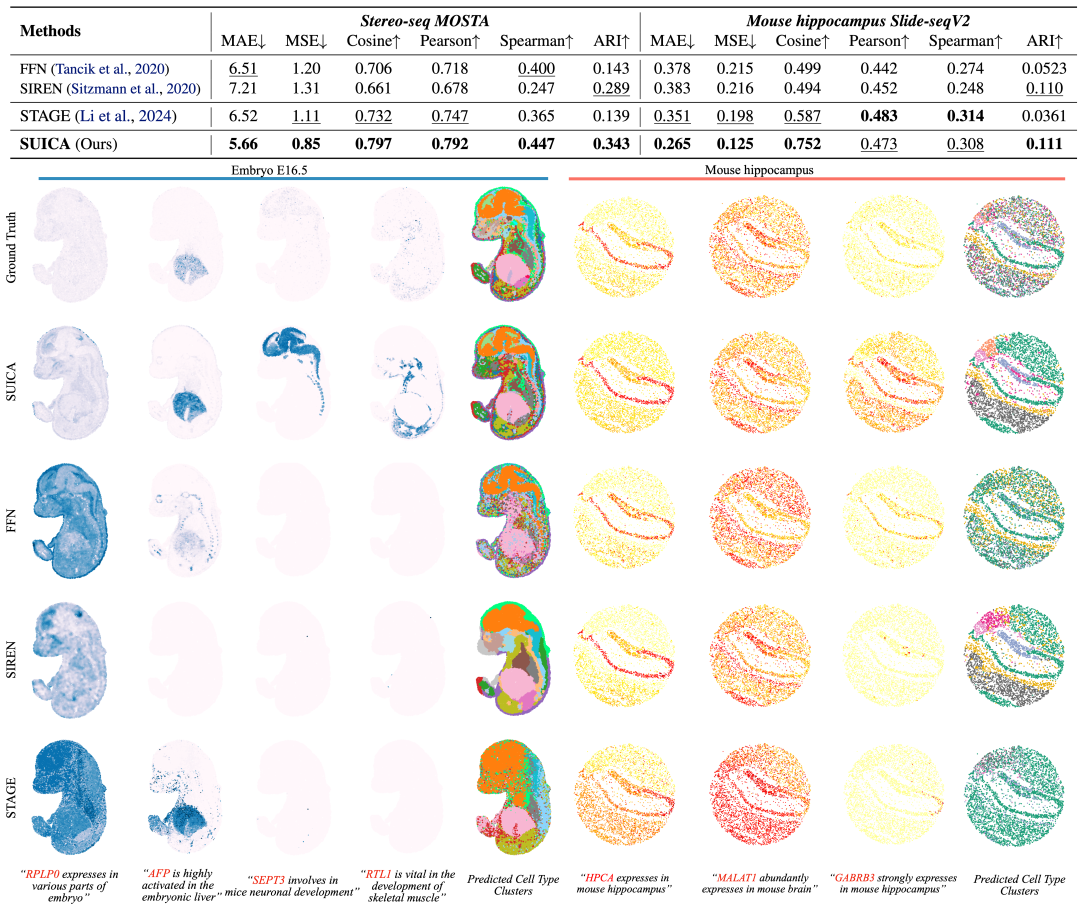
Experimental verification: SUICA can generate more accurate and biologically relevant prediction results
We used stereo-seq mouse embryo data and Slide-seq mouse brain slice data for benchmark comparison. In the task of unknown point prediction (super-resolution), SUICA significantly outperformed existing models and traditional implicit neural representation models, including FFN and SIREN, in multiple key indicators. We visualized the prediction effect of each method, and the results showed that SUICA's prediction can not only accurately restore the expression pattern of genes, but also enhance the expression signal of genes. For example, SEPT3, a gene that plays an important role in the development of the nervous system of mouse embryos, successfully captured this signal despite the fact that the signal in the groundtruth is not obvious.
By clustering and labeling the results generated by various methods, we intuitively found that the cell types generated by SUICA are closest to the real cell types. In addition, the cell types generated by SUICA retain more detailed organ and tissue structures in space.These results demonstrate that SUICA has the ability to enhance biological signals and identify subtle differences in cellular states between different organs and tissues.
Experimental verification: SUICA can reduce the noise of spatial transcriptome data and alleviate the dropout phenomenon
To verify SUICA's denoising ability (gene imputation) and its ability to recover true gene expression from dropout (resulting from 0 reads due to sequencing technology limitations), we artificially added Gaussian noise to the spatial transcriptome data or randomly set gene expression to 0. In the gene imputation experiment, we randomly set 70% of the gene expression in the data to 0. In the gene expression denoising experiment, in order to ensure that the gene expression distribution after adding noise is still similar to the original gene expression distribution, we set all negative values to zero.Experimental results show that SUICA is superior to existing methods in multiple indicators, proving its ability to reduce noise in spatial transcriptome data and alleviate the dropout phenomenon.