Command Palette
Search for a command to run...
The University of Tokyo Team Developed a Deep Learning Framework STAIG to Eliminate Batch Effects Without Pre-alignment, Revealing Detailed Genetic Information in the Tumor Microenvironment

Biological tissues are complex networks composed of multiple cell types that perform important functions through specific spatial configurations. In recent years, advances in spatial transcriptomics (ST) technologies such as 10x Visium, Slide-seq, Stereo-seq, and STARmap have enabled biologists to map genetic data within spatial structures, providing deeper insights into various diseases.
However, ST technology relies heavily on identifying spatial regions with uniform gene expression and histological features.There are two main identification methods: non-spatial clustering and spatial clustering methodsNon-spatial clustering methods only perform clustering based on gene expression, which often leads to incoherent clustering results; spatial clustering methods use graph convolution models to integrate gene and spatial information, but rely on artificially defined distance standards when converting ST data into graph structures, which may introduce bias; at the same time, methods using histological images also face challenges because they are susceptible to changes in staining quality; in addition, batch integration of most existing methods still requires manual intervention, such as manual alignment of coordinates or reliance on additional tools.
To overcome these challenges,A research team from the Institute of Medical Science, University of Tokyo, Japan, proposed a deep learning framework called STAIG (Spatial Transcriptomics Analysis with Image-Assisted Graph Comparative Learning).Ability to integrate gene expression, spatial data, and histological images without alignment.
STAIG extracts features from hematoxylin and eosin (H&E) stained images through a self-supervised model without relying on large-scale histology datasets for pre-training. In addition, STAIG dynamically adjusts the graph structure during training and uses histology image information to selectively exclude homologous negative samples, thereby reducing the bias introduced by the initial construction.
Finally, STAIG identifies commonalities in gene expression through local comparison, achieves end-to-end batch integration, eliminates the need for manual coordinate alignment, and effectively reduces batch effects. The researchers evaluated STAIG on multiple datasets.The results showed that it has good performance in spatial region identification and can reveal detailed spatial and genetic information in the tumor microenvironment, promoting the understanding of complex biological systems.
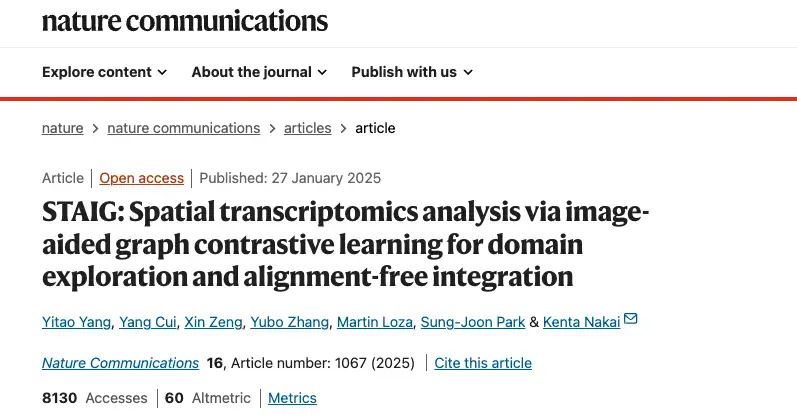
The related results were published in Nature Communications under the title "STAIG: Spatial transcriptomics analysis via image-aided graph contrastive learning for domain exploration and alignment-free integration".
Research highlights:
* STAIG model enables integration of tissue sections without pre-alignment and eliminates batch effects
* STAIG model is applicable to data acquired from different platforms, whether or not histology images are included
* Researchers demonstrate that STAIG can identify spatial regions with high accuracy and reveal new insights into the tumor microenvironment, demonstrating its broad potential for dissecting spatial biological complexity
Paper address:
https://www.nature.com/articles/s41467-025-56276-0
Download address of the dataset used in this study:
https://go.hyper.ai/m5YC4
Dataset: Collection of ST datasets and histology images from different platforms
The researchers downloaded publicly available ST datasets and histology images from different platforms.As shown in the figure below, the ST dataset includes the human dorsolateral prefrontal cortex (DLPFC) dataset, human breast cancer dataset, mouse brain dataset, Slide-seqV2 dataset, STARmap dataset, etc.
Dataset download address:
https://go.hyper.ai/m5YC4
* The human dorsolateral prefrontal cortex (DLPFC) dataset from the 10x Visium platform contains 12 slices from 3 individuals, each of which provides 4 slices with intervals of 10μm and 300μm, and the point counts of each slice range from 3,498 to 4,789. These slices have been manually annotated as cortical layers L1–L6 and white matter (WM);
* The human breast cancer dataset contains 3,798 points;
* The mouse brain dataset includes two slices, anterior and posterior, containing 2,695 and 3,355 points respectively;
* For zebrafish melanoma, the researchers analyzed sections A and B, which contained 2,179 and 2,677 spots, respectively;
* For the ensemble experiment, DLPFC and mouse brain datasets were used. The Stereo-seq dataset of the mouse olfactory bulb contains 19,109 points with a resolution of 14 μm;
* Slide-seqV2 dataset with 10 μm resolution, including rat hippocampus (18,765 points from the central quarter radius) and rat olfactory bulb (19,285 points);
* The STARmap dataset contains 1,207 points;
* For the MERFISH dataset, the human MTG contains 3,970 spots, while the VIS regions of mouse 1 and mouse 2 contain 5,995 and 2,479 spots, respectively.
Model architecture: Image-assisted graph contrast learning for spatial transcriptomics analysis
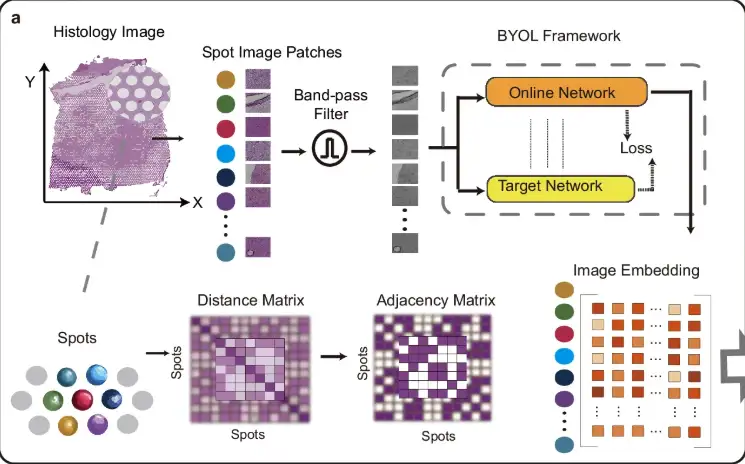
The figure below describes the overall framework of STAIG, a deep learning framework that uses graph contrastive learning combined with high-performance feature extraction to integrate gene expression, spatial coordinates, and histological images. It contains 6 modules:
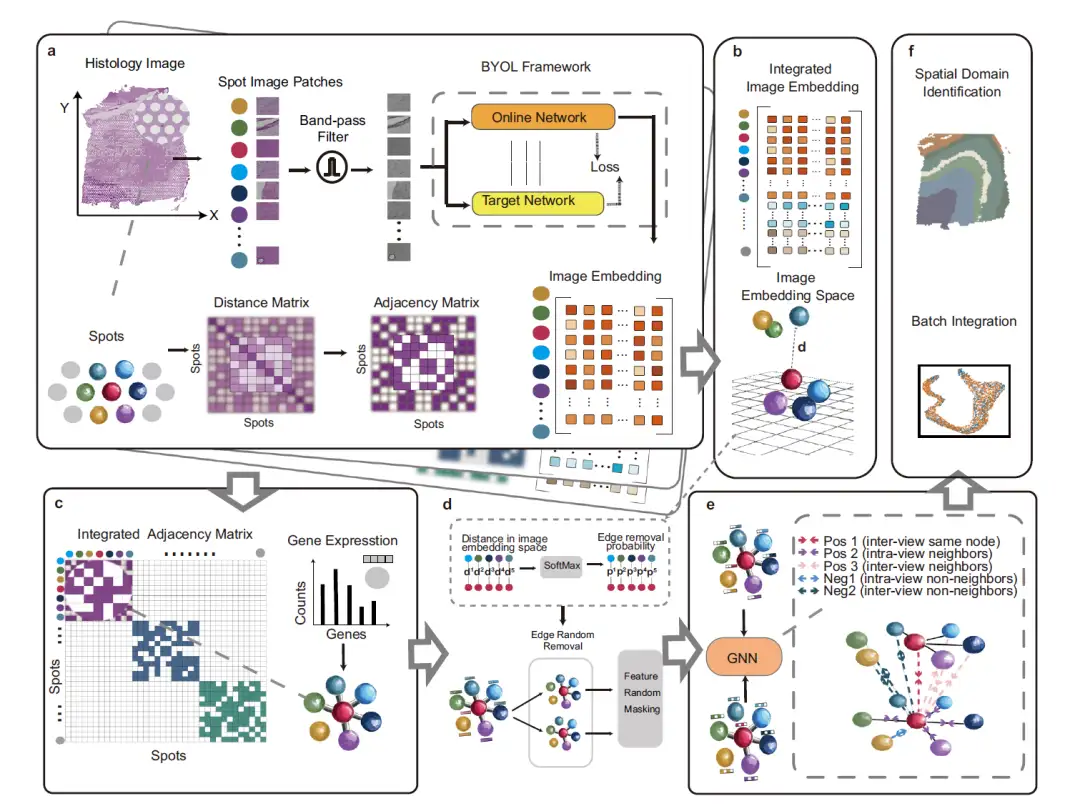
First, as shown in part a of the following figure, in order to reduce the impact of noise and uneven tissue staining, STAIG first divides the histological image into small patches (Spot Image Patches) aligned with the spatial positions of the data points, and then uses a band-pass filter to optimize the image. The image embedding features are extracted through the Bootstrap Your Own Latent (BYOL) self-supervised model, and an adjacency matrix is constructed based on the spatial distance between data points.
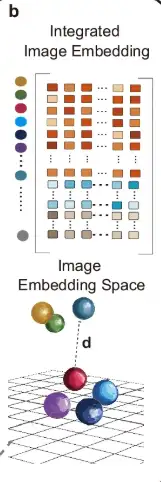
As shown in part b of the following figure, in order to integrate the data of different tissue sections, STAIG uses a vertical stacking method to embed features of multiple tissue sections.
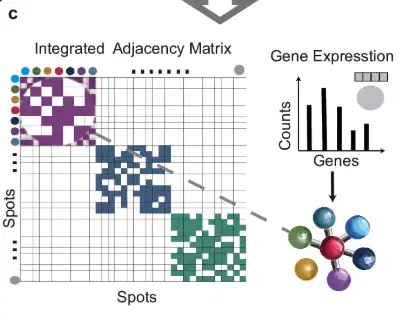
As shown in part c of the figure below, the adjacency matrices of each slice are merged using the diagonal placement method to form an integrated adjacency matrix, which is then used to construct a graph structure with gene expression data as node information.
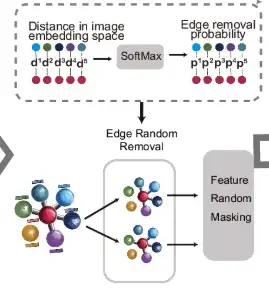
As shown in part d of the following figure, for the measurement points connected by edges, their distances are calculated in the image embedding space, and the SoftMax function is used to convert these distances into the probability of random edge removal. On this basis, the original graph undergoes two rounds of random edge removal (Edge Random Removal) to generate two enhanced views. Then, the node features in these views are randomly masked.
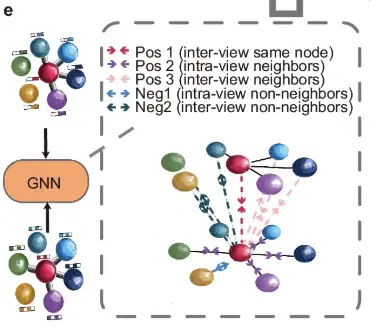
Then, as shown in part e of the figure, the augmented view is subsequently processed by a shared graph neural network (GNN) and guided by a neighboring contrastive objective, which aims to bring neighboring nodes closer together while moving non-neighboring nodes further away in both graph views.
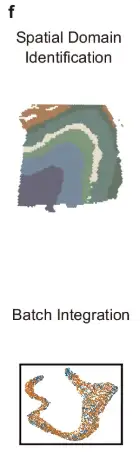
Finally, as shown in Figure f, the trained GNN generates embeddings to identify spatial regions and minimize batch effects between consecutive tissue sections.
Research results: STAIG shows superior performance under various conditions
The research team conducted an extensive benchmark evaluation to compare STAIG with other state-of-the-art ST techniques.The results show that STAIG exhibits superior performance under various conditions.
Brain region recognition performance evaluation
To evaluate the performance of STAIG in tissue region recognition, the researchers compared STAIG with existing methods, including Seurat, GraphST, DeepST, STAGATE, SpaGCN, SEDR, ConST, MuCoST, and stLearn. The performance evaluation indicators include:
* Adjusted Rand Index (ARI) and Normalized Mutual Information (NMI) (for manually annotated datasets).
* Silhouette coefficient (SC) and Davis-Bolding index (DB) (for other datasets).
① Performance of the human brain dataset
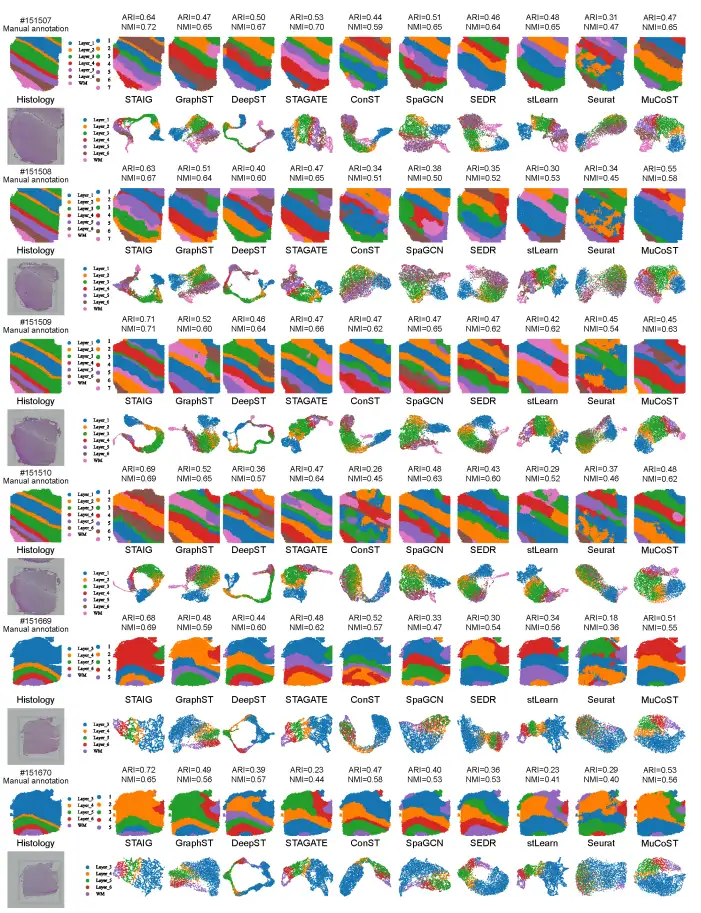
Overall,STAIG performs best on the human brain dataset.The highest median ARI (0.69) and NMI (0.71) were achieved, as shown in the following figure:
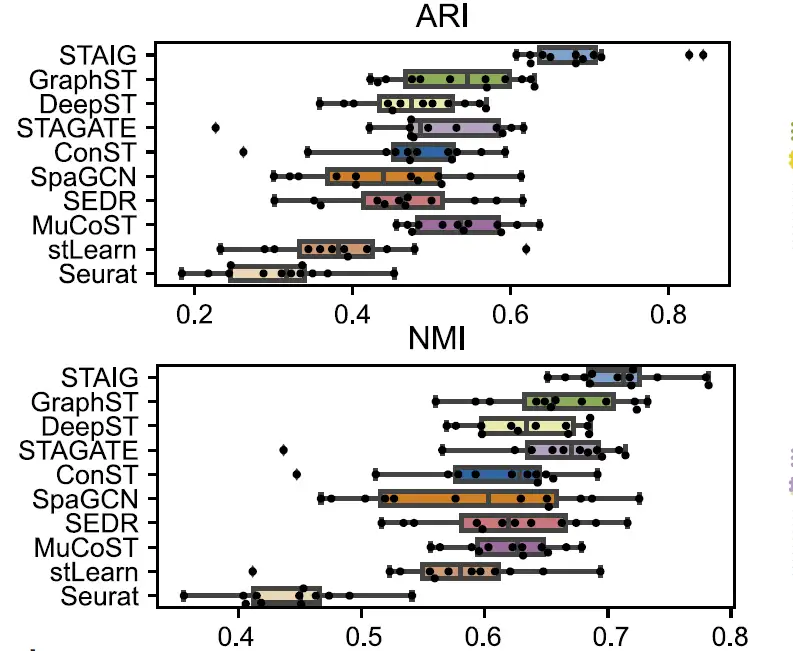
In comparison, existing methods perform poorly: stLearn misjudges some points and misses some layers; GraphST has an ARI of 0.64 and an NMI of 0.73, but has large deviations in the positions of L4 and L5 layers; the ARIs of other methods range from 0.25–0.57 and the NMIs range from 0.42–0.69, mainly due to inaccurate identification of layer proportions.
② Performance of the mouse brain dataset
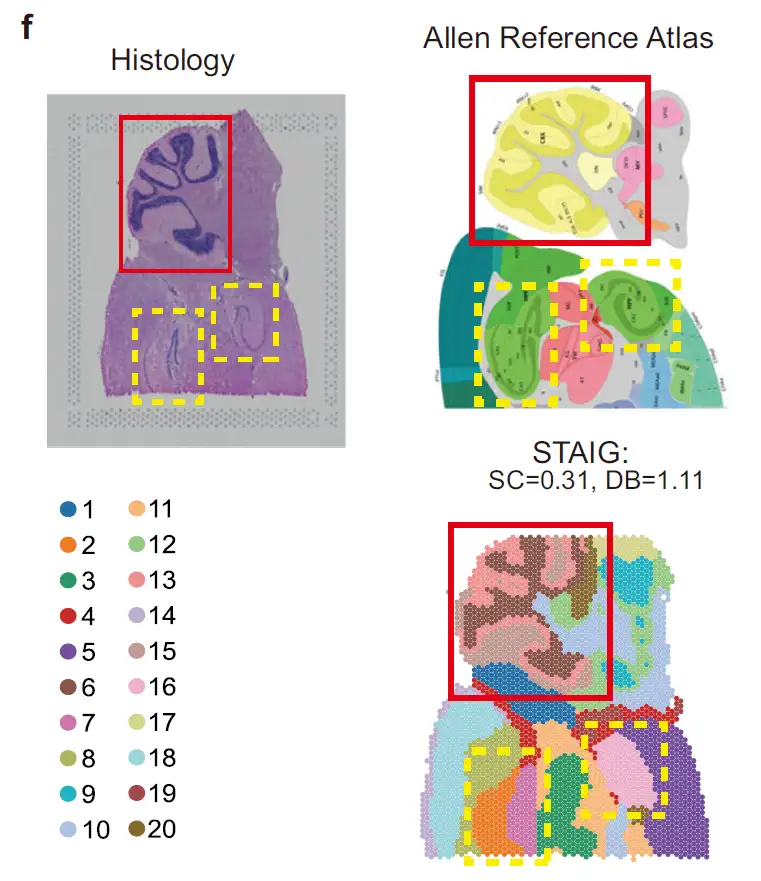
As shown in the figure below, in the mouse hindbrain dataset,STAIG successfully identified the cerebellar cortex and hippocampus, and further distinguished the Ammon's horn (CA) and dentate gyrus.Highly consistent with the Allen mouse brain atlas annotation; despite the lack of manual annotation, STAIG still achieved the highest SC (0.31) and lowest DB (1.11), indicating its superior clustering performance.
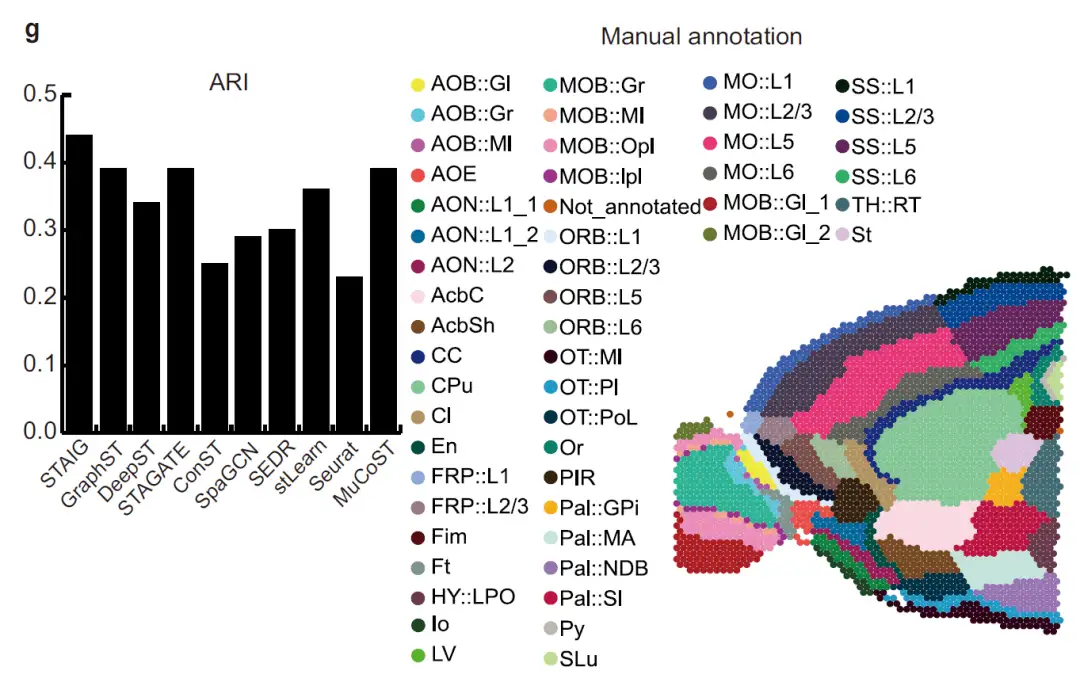
As shown in the figure below, in the mouse forebrain dataset,STAIG accurately segmented the olfactory bulb and dorsal pallium.After referring to the manual annotation of Long et al., its ARI reached 0.44 and NMI reached 0.72, both of which were the highest values.
Effectiveness of Image Feature Extraction
To explore the impact of image features, the researchers used the KNN algorithm to compare the image features extracted by STAIG with those extracted by other methods (stLearn, DeepST, and ConST).
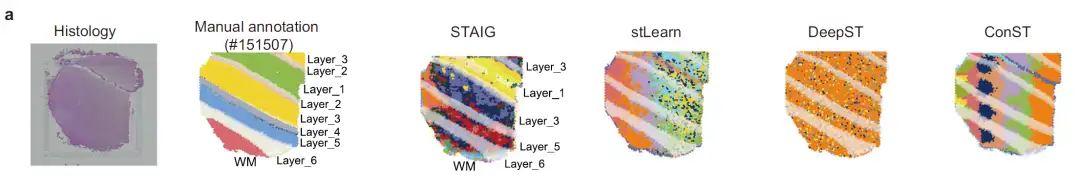
① Brain tissue slice analysis
Taking slice #151507 as an example, as shown in the figure below, the image features of stLearn are seriously affected by the staining intensity, resulting in a mismatch with the actual hierarchical annotation; although DeepST and ConST use deep learning, they fail to accurately capture the complex texture features of brain tissue; the feature extraction results of STAIG are highly matched with the manually annotated levels, although some boundaries are still slightly blurred, they are almost unaffected by staining differences.
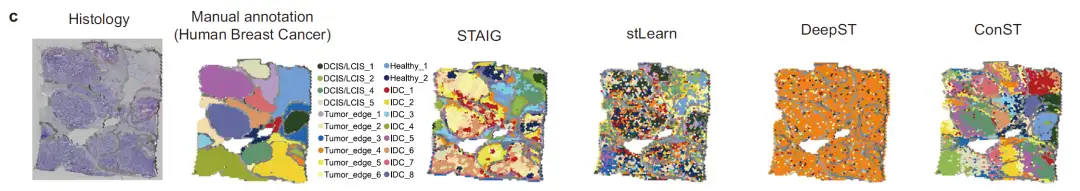
② Breast cancer tissue image analysis
The researchers further tested the image feature extraction capability using human breast cancer H&E stained images, as shown in the figure below.
The results showed that stLearn's image features mixed tumor and normal areas, with poor discrimination; ConST seemed to divide the image into different regions, but after zooming in, the region boundaries deviated greatly from the manual annotations; DeepST failed to extract effective image features;STAIG accurately identifies tumor regions. Its spatial clustering results maintain a high degree of regional coherence, and the segmented regions almost perfectly match the manually annotated contours.Verified its excellent image feature extraction ability.
Defining the tumor microenvironment in human breast cancer ST
In an analysis of a human breast cancer dataset,The researchers found that STAIG's results were highly consistent with manual annotations and achieved the highest ARI (0.64) and NMI (0.70).It is noteworthy that STAIG proposes a slightly different but more refined spatial stratification, especially for the Healthy_1 region in the manual annotation (Figure 2a), which STAIG subdivides into subclusters 3 and 4 (Figure 2b).
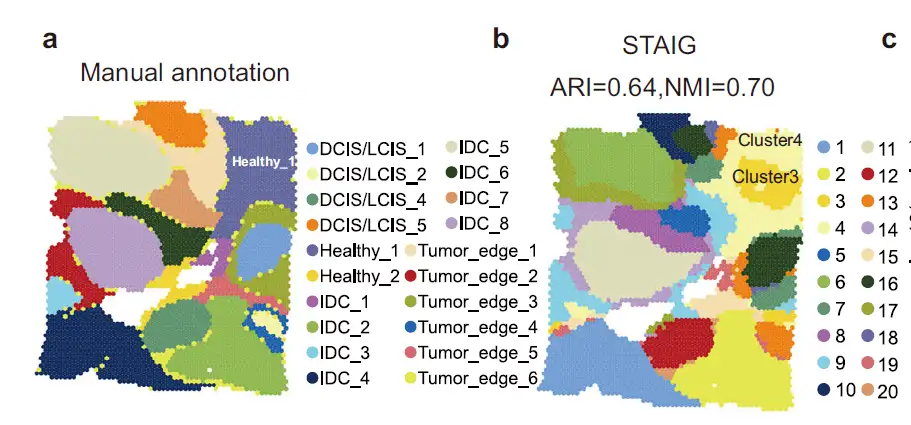
In conclusion, through multimodal integration of STAIG, we found that subcluster 3 formed a CAF-dense tumor microenvironment and revealed the molecular characteristics of CAF-rich areas.
Deep learning provides powerful tools for ST technology development
With the rapid development of genomics and ST technology, the biomedical community has been able to explore the spatial distribution of gene expression within tissues, thereby revealing the complex functions and structures of organisms. ST technology not only provides quantitative information on gene expression, but also preserves the spatial relationship of cells in tissues, allowing researchers to study tissue microenvironments, cell interactions, and the spatial characteristics of disease occurrence and development. However,Since ST data usually have problems such as high dimensionality, strong noise and batch effects, how to effectively integrate and analyze these data has become a core challenge in current research.
Deep learning technology, especially the introduction of graph neural networks (GNNs) and contrastive learning methods, provides powerful tools for the analysis of ST data. Traditional analysis methods often rely on dimensionality reduction and clustering, while deep learning methods can automatically extract multi-level features and optimize data representation through end-to-end training. As mentioned earlier, GNN-based methods can use spatial adjacency information to construct graph structures, so that the model can capture gene expression while also learning the spatial dependencies between cells. The introduction of contrastive learning further enhances the generalization ability of the model, enabling it to learn key spatial features without annotation.
In addition, the industry has made a lot of progress in combining deep learning + ST technology:
November 2024The team led by Yang Yungui from the National Center for Bioinformatics of China and the team led by Zhang Shihua from the Institute of Mathematics and Systems Science of the Chinese Academy of Sciences have developed a deep learning-based spatial transcriptome cell annotation tool called STASCAN.By integrating gene expression profiles and cell feature learning from histological images, we predict cell types in unknown regions of tissue sections and annotate cells within the captured region, thereby greatly improving spatial cell resolution. In addition, STASCAN is applicable to different datasets from different ST technologies and shows significant advantages in deciphering high-resolution cell distribution and resolving enhanced tissue structure.
This result was published in Genome Biology under the title “STASCAN deciphers fine-resolution cell distribution maps in spatial transcriptomics by deep learning”.
* Paper address:
https://genomebiology.biomedcentral.com/articles/10.1186/s13059-024-03421-5
January 23, 2025A research team from Princeton University in the United States has developed a new deep learning algorithm GASTON (Gradient Analysis of Spatial Transcriptomics Organization with Neural networks). By combining unsupervised deep neural networks with interpretable algorithms, GASTON innovatively proposed the concept of "isodepth", which is similar to the altitude in a topographic map and is used to quantify the spatial topological structure of gene expression in tissue sections.
By iso-depth and its gradient, researchers can not only segment different spatial regions of tissues, but also identify the continuous change trend of gene expression in tissues and key marker genes. This study demonstrated the successful application of GASTON in a variety of biological samples, including mouse brain, mouse olfactory bulb, colorectal cancer tumor microenvironment, etc. The results show that GASTON can accurately analyze tissue structure, reveal the spatial distribution and change patterns of cell types, and at the same time discover many spatial gene expression patterns that are overlooked in other methods.
The related results were published in Nature Methods under the title "Mapping the topography of spatial gene expression with interpretable deep learning".
* Paper address:
https://www.nature.com/articles/s41592-024-02503-3
Obviously, the combination of deep learning and ST technology not only improves the ability of data integration and noise reduction, but also promotes the in-depth mining of spatial biological information. In the future, with the growth of computing resources and the optimization of algorithms, deep learning will play a more important role in ST data analysis and provide stronger support for precision medicine and personalized treatment.
References:
1.https://static-content.springer.com/esm/art%3A10.1038%2Fs41467-025-56276-0/MediaObjects/41467_2025_56276_MOESM1_ESM.pdf
2.https://www.bjqykxy.com/kexueyanjiu/dongwuzhiwu/7361.html
3.https://news.qq.com/rain/a/20250128A057OQ00?suid=&media_id=
4.https://www.medsci.cn/article/show_