Command Palette
Search for a command to run...
Solving the Data Shortage Problem of the Qinghai-Tibet Plateau! A Team From Zhejiang University Proposed a New GeoAI Model to Explain the Distribution of Surface Heat Flow on the Qinghai-Tibet Plateau

In earth science research, surface heat flow (SHF) has always attracted much attention as an important representation of the release of deep heat energy in the earth.Surface heat flow is not only a "window" into the energy driving the Earth's interior, but also a key parameter that reveals the thermal structure of the crust, the thermodynamics of the mantle, and the evolution of geological structures.Through the study of surface heat flow, we can gain a deeper understanding of the thermal mechanisms inside the Earth and reveal the dynamic processes behind geological phenomena such as plate subduction, mantle upwelling and rift expansion.
Although much progress has been made in surface heat flow research in the past few decades, there are still many unsolved mysteries in certain regions around the world, especially in complex tectonic zones such as the Qinghai-Tibet Plateau.
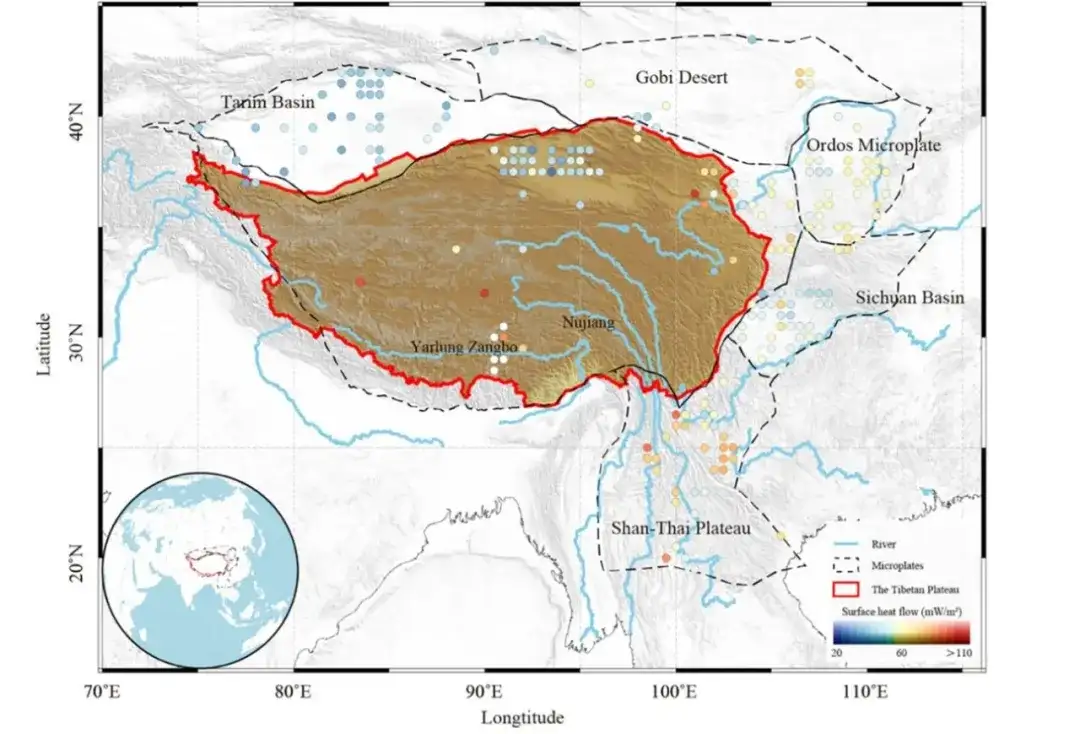
As the "third pole" of the earth, the Qinghai-Tibet Plateau has become a natural laboratory for studying geodynamics with its huge landform height difference and complex tectonic features. Since the collision of the Indian Plate and the Eurasian Plate, this area has experienced intense tectonic activity, forming a variety of geological units and thermal anomalies. Research in recent years has found thatThe surface heat flow of the Qinghai-Tibet Plateau has significant geographical spatial heterogeneity: high heat flow values are concentrated in the Yarlung Zangbo suture zone and the north-south rift zone, while the heat flow distribution in other areas is relatively low.However, due to the scarcity of measurement points and limited coverage, there are still major technical bottlenecks in the quantitative analysis of the heat flow distribution law. Especially in those areas with rugged terrain and few people, traditional drilling measurement methods and observation equipment are difficult to carry out on a large scale, resulting in almost no surface heat flow data in these areas.
To solve this problem, the School of Earth Sciences of Zhejiang University proposed a spatial intelligence method - the geographic neural network weighted regression model with enhanced interpretability (EI-GNNWR).This method captures the nonlinear relationship of surface heat flow by integrating the spatial heterogeneity characteristics of geophysical and geological data, providing a new research framework and technical support for a comprehensive understanding of the heat flow distribution and geodynamic mechanism of the Qinghai-Tibet Plateau.
The related research was published in the Journal of Geophysical Research: Solid Earth, a well-known journal in the field of earth sciences, under the title “The Distribution of Surface Heat Flow on the Tibetan Plateau Revealed by Data‐Driven Methods”.
Research highlights:
* A data-driven approach to interpretability that fully considers geological structure information and geophysical data is proposed: the EI-GNNWR model
* The EI-GNNWR model accurately predicts the surface heat flow maps of Australia and the Qinghai-Tibet Plateau. The prediction accuracy is significantly higher than that of the four major models, XGBoost, FCNN, OLR and GWR, which effectively makes up for the lack of surface heat flow data in the Qinghai-Tibet Plateau.
* The EI-GNNWR model effectively reveals the distribution of surface heat flow on the Qinghai-Tibet Plateau and its influencing mechanism
Paper address:
https://doi.org/10.1029/2023JB028491
The open source project "awesome-ai4s" brings together more than 100 AI4S paper interpretations and provides massive data sets and tools:
https://github.com/hyperai/awesome-ai4s
Model training based on the Tibetan Plateau and global surface heat flow datasets
The researchers merged the globally compiled surface heat flow dataset, the NGHF land heat flow dataset, and my country's surface heat flow dataset for the Qinghai-Tibet Plateau, and removed the ocean measurement data and all measurement data marked as "D: Data not used for heat flow map" to form the initial dataset.
The address of the surface heat flow dataset for mainland China is:
Since there are few measured data sets for the Qinghai-Tibet Plateau, existing observations are mainly concentrated on the edge of the plateau, and the internal area is limited. Therefore, the researchers included surface heat flow measurement data from surrounding plates to expand the data set.
In this study, 220 surface heat flow measurement points were used, of which 90% were used as training and validation datasets for the model, and 10% were used as test datasets.To verify the accuracy of the model. In order to improve the experimental accuracy, the researchers used cross-validation technology in the model training and verification stages.
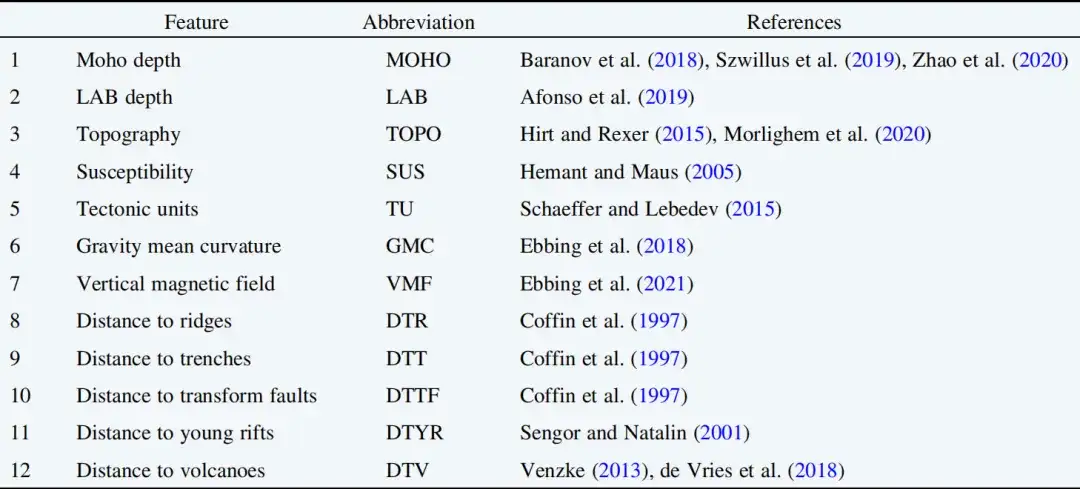
In addition, to predict the surface heat flow value in the Qinghai-Tibet Plateau where data is scarce, it is necessary to fit the relationship between this value and geophysical and geological characteristics. To this end, the researchers selected some key features related to surface heat flow, as shown in the table below.
Based on the GNNWR model, the SHAP value calculation method is introduced
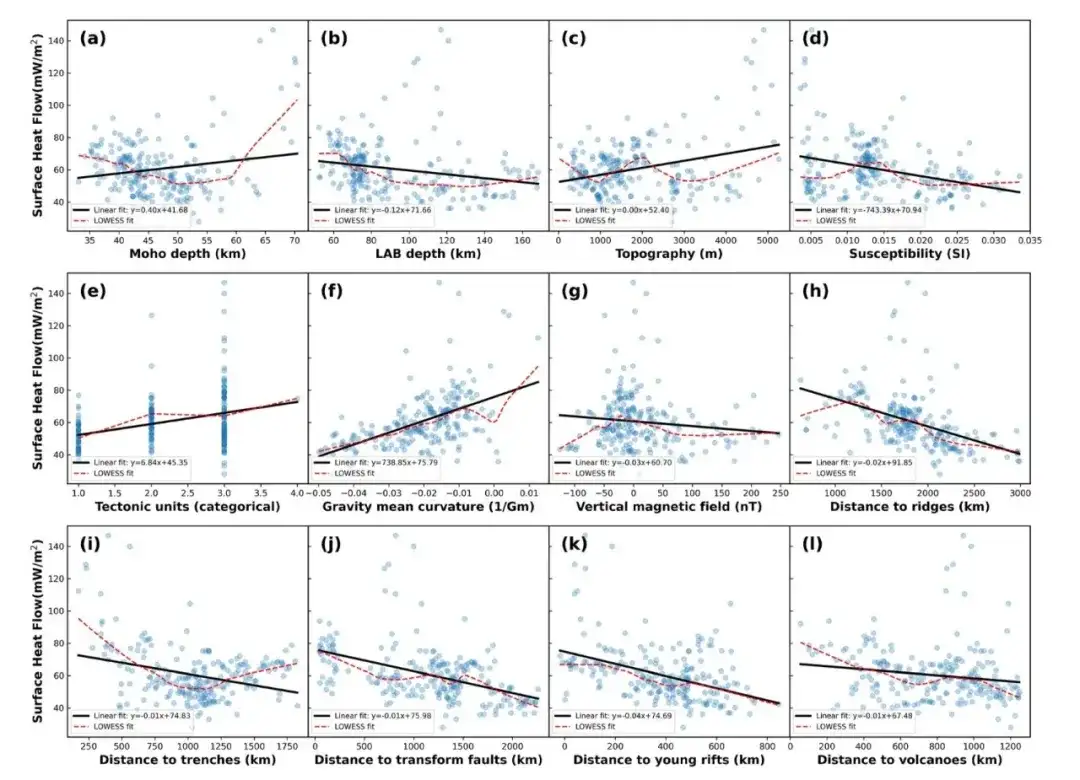
The surface heat flow measurement data on the Qinghai-Tibet Plateau are relatively limited and show significant spatial non-stationarity.In addition, as shown in the figure below, the nonparametric locally weighted scatter smoothing (LOWESS) trend line shows significant fluctuations between parameters such as Moho depth, topography, tectonic units, and distance to young rifts and surface heat flow, indicating that there is a complex nonlinear relationship between surface heat flow and geological and geophysical parameters.
To address this problem, the researchers used the GNNWR model, which combines ordinary linear regression (OLR) with a neural network algorithm to accurately capture spatial non-stationarity, thereby establishing a robust regression framework for the correlation of surface heat flow with geological and geophysical data.
To further improve the interpretability of the GNNWR model and precisely quantify the contribution of each variable to the surface heat flow value, the researchers used the SHapley Additive exPlanations (SHAP) value calculation method. This method can quantify local interactions and assign importance values to individual features in a specific prediction, thereby providing more detailed local nuanced explanations.Based on this integration approach, the researchers proposed a geographic neural network weighted regression model with enhanced interpretability (EI-GNNWR).
SHAP related tutorial address:
https://go.hyper.ai/deK6H
The prediction accuracy of the EI-GNNWR model is significantly higher than that of other models.
To test the effectiveness of the EI-GNNWR model, the researchers selected an Australian region where geothermal data is extensive and accurate for validation.
Since Australia is a center of extensive geothermal exploration and has rich and relatively accurate surface heat flow measurement data, it is an ideal test field for the effectiveness of data-driven methods. Based on this, the researchers first chose to test the model in Australia and compared the prediction results of the spatial distribution of surface heat flow in Australia with four different models.These models are Extreme Gradient Boosting (XGBoost), Fully Connected Neural Network (FCNN), Ordinary Linear Regression (OLR), and Geographically Weighted Regression (GWR) models.
The evaluation results are shown in the figure below. The EI-GNNWR model performs well in predictive performance, with an R² value of 0.823, which is 36%, 31%, 22% and 4% higher than the XGBoost, FCNN, OLR and GWR models, respectively. In addition, its normalized RMSE is only 0.10, which is 47%, 50%, 44.4% and 23% lower than the XGBoost, FCNN, OLR and GWR models, respectively. Compared with the previous R² value of the XGBoost model in the Australian region, this model has improved by 17%; the normalized RMSE is also 55% lower than the previously reported value.
* The R² of a model is a statistical indicator used to evaluate the model fit. The higher the R², the better the model fit and the better the prediction performance.
* RMSE (root mean square error) is a commonly used indicator for evaluating the prediction error of a regression model. It is used to measure the gap between the model prediction value and the true value. The smaller the RMSE, the closer the model prediction is to the true value.
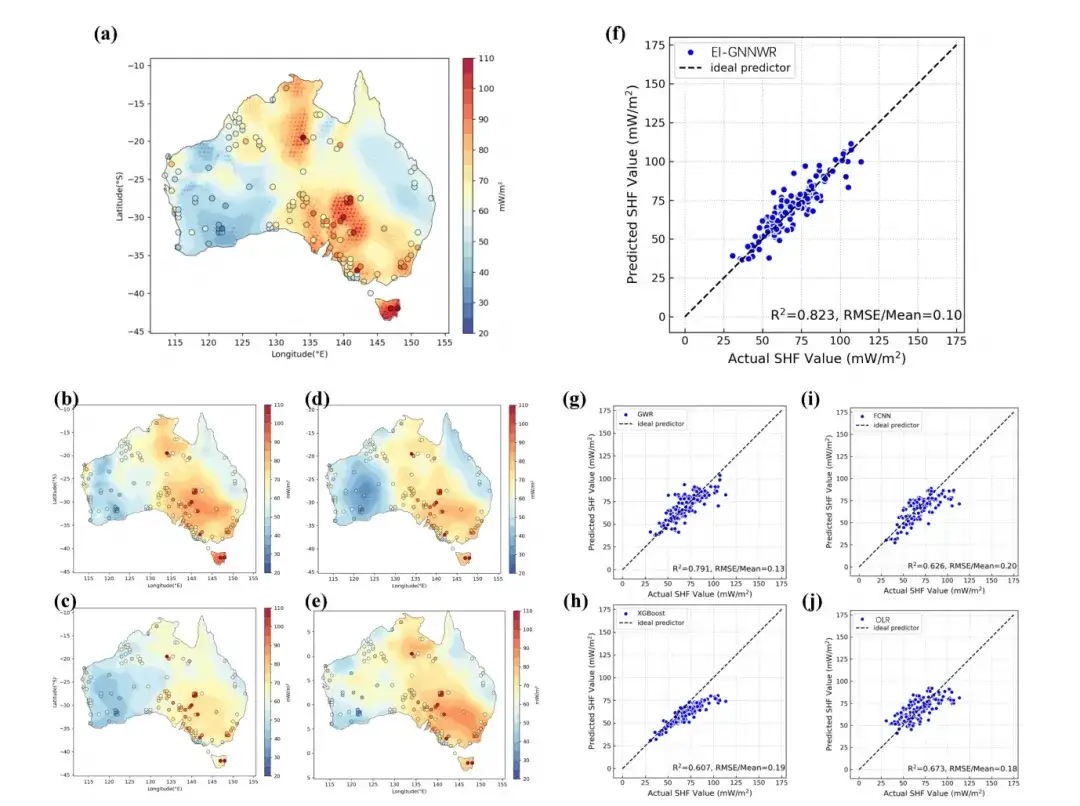
(a) EI-GNNWR model
(b) GWR model
(c) XGBoost model
(d) FCNN model
(e) OLR model
The circles on the map indicate the measurement points, and the adjacent scatter plots (f–j) show the relationship between the measured surface heat flow values and the model predicted values.
Revealing the distribution of surface heat flow on the Qinghai-Tibet Plateau based on spatial intelligence methods
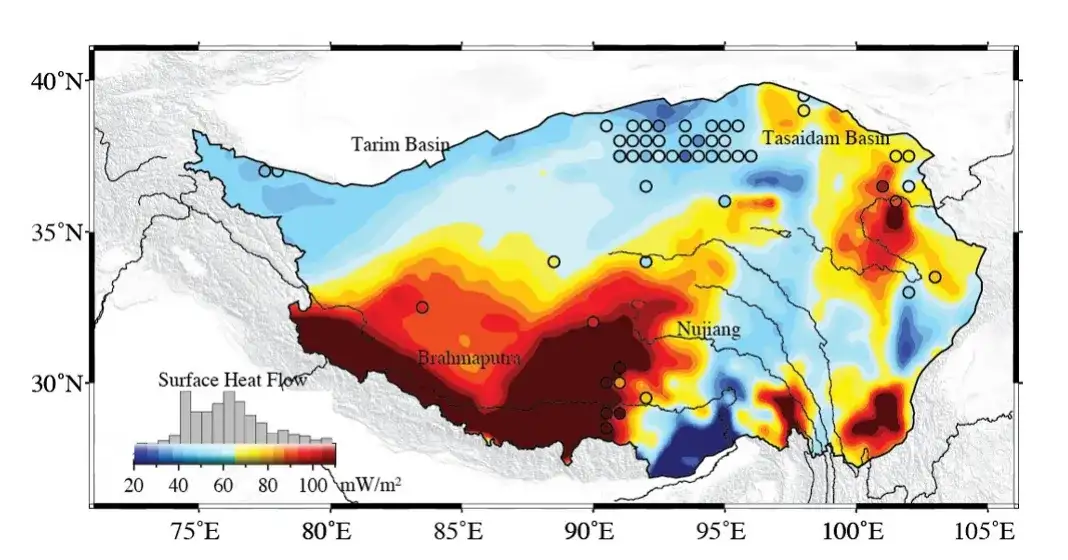
After validating the effectiveness of the EI-GNNWR method in Australia, the researchers trained the new model using surface heat flow measurement points from the Qinghai-Tibet Plateau and surrounding areas.
The results show that the model has a high prediction accuracy, with an R² value of 0.91, a normalized RMSE of 0.07, and an error level within 7%. The researchers produced a surface heat flow (SHF) distribution map of the Qinghai-Tibet Plateau. As shown in the figure below, the average heat flow value of the Qinghai-Tibet Plateau is 66.2 mW/m², which is significantly higher than the global average of 62.8 mW/m².As one of the regions with the most intense tectonic activity in the world, the heat flow of the Qinghai-Tibet Plateau is unevenly distributed. The high heat flow areas are mainly concentrated in the south, northeast and southeast, especially in the Yarlung Zangbo suture zone, the northeastern boundary of the plateau and the Tengchong area in western Yunnan.
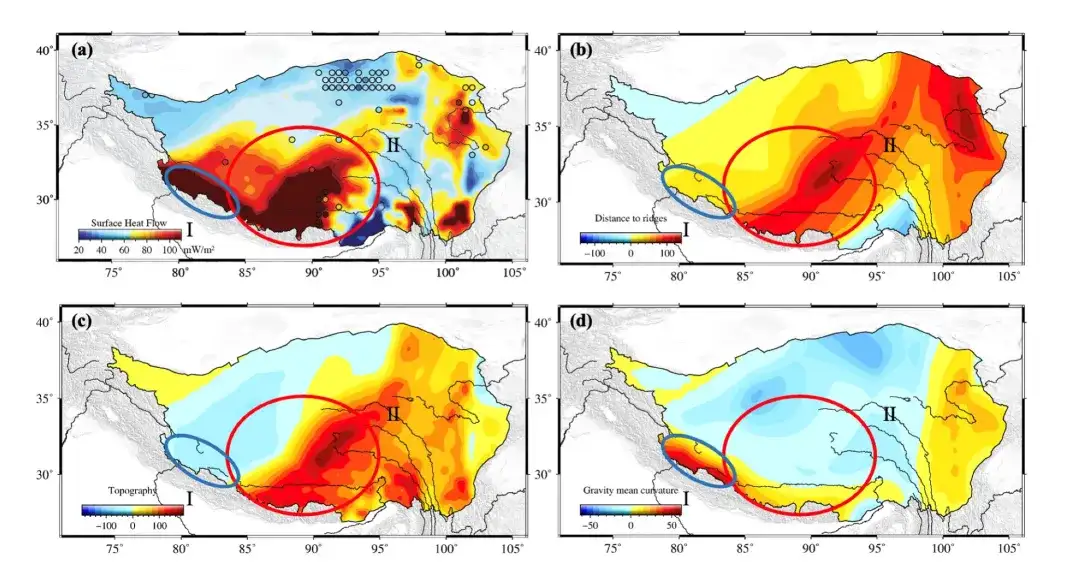
To better understand the determinants of geothermal formation, the researchers also analyzed the spatial distribution of SHAP values in the EI-GNNWR model (as shown in the figure below), focusing on the role of geological and geophysical variables. This approach identified the specific contribution of each variable to the formation of surface heat flow and clarified the relationship between these variables and geothermal activity.
By focusing on heat flow patterns in the southwestern Qinghai-Tibet Plateau, the researchers explored the interaction of geological and geophysical factors in shaping geothermal energy generation.Taking the area between the Yarlung Zangbo River and the Nujiang River as an example (area Ⅰ in the figure below), the predicted surface heat flow value exceeds 90 mW/m². The SHAP value shows that the distance from the ridge and the gravity mean curvature have a positive effect on the increase of surface heat flow, which is consistent with the local melting and high surface heat flow values of the Himalayan orogenic belt. The gravity mean curvature has a significant impact on the formation of geothermal anomalies, especially in the melting zone of the orogenic belt in the low seismic velocity zone.
In area II of the figure below, significantly higher surface heat flow values are closely related to the proximity of ridges and the complexity of topography. Ridges in young crustal regions affect surface heat flow values through the rise of mantle material, while topographic changes shape geothermal distribution and intensity, forming a unique geothermal pattern in this region.
Based on GNNWR, it helps multi-field geoscience applications
In 2020, researchers from the School of Earth Sciences at Zhejiang University proposed Geographic Neural Network Weighted Regression (GNNWR), a model for addressing spatial nonstationarity in various domains with complex geographic processes.Based on this model, the researchers further proposed a series of models for use in oceanography, geography, atmospheric science, geology and other fields, and have published more than 30 related papers.
Paper address:
https://www.tandfonline.com/doi/full/10.1080/13658816.2019.1707834
GNNWR open source address:
https://github.com/zjuwss/gnnwr
Specifically,In the field of housing price analysis,In order to solve the problem that the abstract "spatial proximity" cannot construct a loss function and the neural network is difficult to train, the researchers further combined OSP with GNNWR to construct the osp-GNNWR model. Through the study of simulated data sets and empirical cases of housing prices in Wuhan, the model has been proven to have better global performance and can more accurately describe complex spatial processes and geographical phenomena.
Click to read the detailed report: Accurately predict Wuhan housing prices! Zhejiang University GIS Laboratory proposed the osp-GNNWR model: accurately describe complex spatial processes and geographical phenomena
In the field of atmospheric science,The GNNWR model can establish spatially non-stationary regression relationships, estimate PM2.5 concentrations, and provide high-precision, detailed PM2.5 distributions across the country. For example, through geospatial modeling, we found that PM2.5 concentrations are generally high from Beijing to Lianyungang, which may be affected by factors such as wind direction and wind speed. In addition, shelterbelts in specific areas may inhibit the spread of PM2.5.
The related paper was published in MDPI with the title “Satellite-Based Mapping of High-Resolution Ground-Level PM(2.5) with VIIRS IP AOD in China through Spatially Neural Network Weighted Regression”.
Paper address:
https://www.mdpi.com/2072-4292/13/10/1979
In the field of geology,Especially in the prediction of spatial distribution of gold mines, the GNNWR model integrates spatial patterns and neural networks, and combines with Shapley's additive interpretation theory, which can not only greatly improve the accuracy of predictions, but also improve the interpretability of mineral predictions in complex spatial scenarios.
Click to view detailed report: Better than five advanced models, the GNNWLR model proposed by Du Zhenhong's team at Zhejiang University: improving the accuracy of mineralization prediction
In terms of marine ecological environment modeling,The researchers proposed a new deep learning prediction model, ChloroFormer, which combines Fourier analysis and Transformer neural network, and adopts a time series decomposition architecture to effectively improve the accuracy of chl-a concentration prediction. In addition, the researchers conducted experiments in two different coastal research areas. The results showed that the proposed model not only outperformed the other six comparison models in multi-step prediction accuracy, but also maintained its relative advantages in extreme and frequent algal blooms.
Click to view detailed report: Deep learning fights marine red tide crisis! Zhejiang University GIS Laboratory proposes ChloroFormer model to provide early warning of marine algae outbreaks
In the future, the team is committed to fully developing GIS theory and methods, and geoscientific intelligent analysis platform technology, and continuing to explore the development of GeoAI.
GNNWR research team leader Wu Sensen's personal homepage and a brief introduction to the spatiotemporal intelligent regression model:
https://mypage.zju.edu.cn/wusen