Command Palette
Search for a command to run...
Accurately Predict the Unemployment Rate and Poverty Rate in the United States. Google's Basic Model of Population Dynamics PDFM Has Been Open Sourced to Enhance Existing Geospatial Models

Disease, economic crisis, unemployment, disasters... the human world has long been "invaded" by various problems.Understanding population dynamics is critical to solving complex social problems such as these.Government officials can use population dynamics data to simulate the spread of diseases, predict housing prices and unemployment rates, and even predict economic crises. However, over the past few decades, how to accurately predict population dynamics has been a challenge for researchers and policymakers.
Traditional methods of understanding population dynamics often rely on census, survey or satellite image data. These data are valuable, but they each have their own shortcomings. For example, although the census is comprehensive, it cannot be conducted frequently and is costly; surveys can provide local insights, but often lack scale and universality; satellite images provide a broad overview, but lack detailed information about human activities. To make up for these shortcomings, Google has built a large number of data sets over the years, hoping to understand the characteristics of population behavior.
Recently, Google proposed a novel Population Dynamics Foundation Model (PDFM), which uses machine learning to integrate the rich geospatial data available worldwide, greatly expanding the capabilities of traditional geospatial models.The researchers benchmarked PDFM on interpolation, extrapolation, and super-resolution problems in 27 tasks covering health, socioeconomics, and the environment. The study found that PDFM achieved state-of-the-art performance in interpolation for all 27 tasks and best performance in 25 of the extrapolation and super-resolution tasks.The researchers also demonstrated that PDFM can be combined with a state-of-the-art forecasting base model (TimesFM) to successfully predict unemployment and poverty rates, outperforming fully supervised forecasting methods.
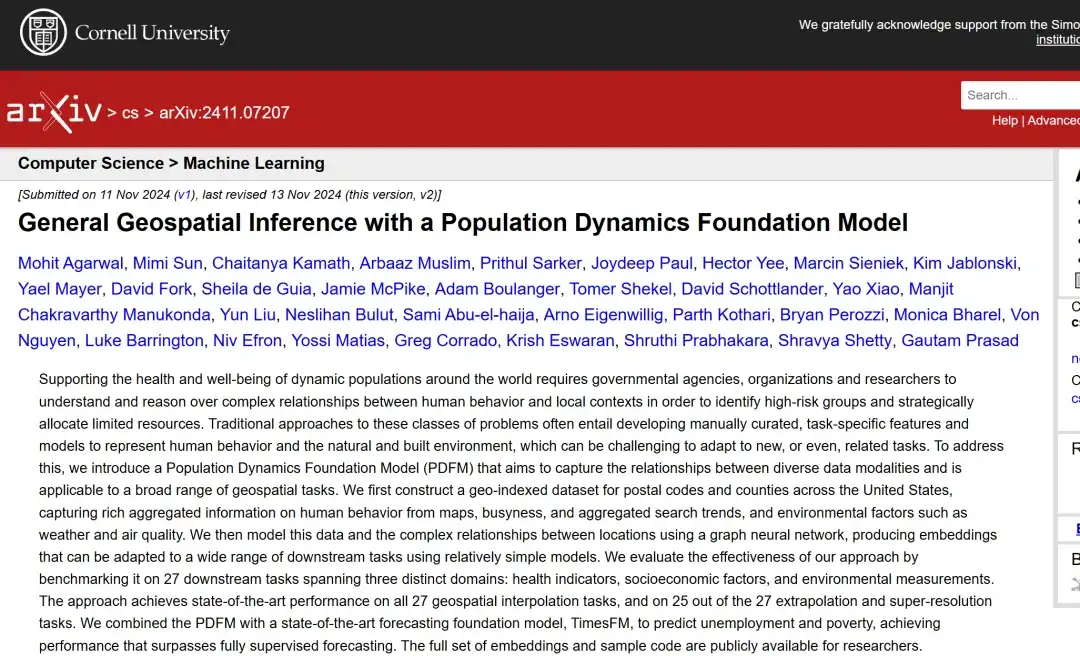
The related research was published on arXiv under the title "General Geospatial Inference with a Population Dynamics Foundation Model". At the same time, the researchers released all PDFM embeddings and sample codes on GitHub to facilitate the research community to apply it to new use cases and further empower academic research and practice.
PDFM project open source address:
https://github.com/google-research/population-dynamic
Research highlights:
* Researchers introduced a decoupled embedding architecture that partitions the embedding dimension by data source, ensuring that the model can attend to all inputs and retain relevant information for each data, while providing data source-level interpretability for downstream tasks
* Researchers demonstrated how PDFM can be used to enhance the state-of-the-art forecasting base model TimesFM, thereby improving forecasts of county-level unemployment rates and zip code-level poverty rates. Similar approaches can also be used to enhance other existing geospatial classification and regression models using PDFM embeddings
* Through strong performance in interpolation, extrapolation, super-resolution, and prediction tasks, researchers demonstrated that PDFM can be easily extended to a variety of application scenarios requiring geospatial modeling, including scientific research, public welfare, public and environmental health, and commercial fields
Paper address:
https://arxiv.org/abs/2411.07207
The open source project "awesome-ai4s" brings together more than 100 AI4S paper interpretations and provides massive data sets and tools:
https://github.com/hyperai/awesome-ai4s
Datasets: Five common datasets
To develop PDFM, the researchers collected and organized five large datasets covering geographic areas at the zip code and county levels:
① Aggregated Search Trends:The researchers calculated aggregate counts for the top 500 queries in July 2022, requiring them to be searched at least 20 times in each ZIP code area, resulting in more than 1 million unique queries. They then ranked these queries by their national popularity, using the total number of ZIP codes in which each query appeared as an indicator, and selected the top 1,000 most common queries as a representative of aggregate search trend activity at the national ZIP code level.
② Map Dataset (Maps):The researchers selected the 1,192 most common point-of-interest categories in Google Maps in May 2024 that appeared in at least 5% zip codes. Each category covers a wide range of point-of-interest locations, for example, the "medical facilities" category includes children's hospitals and university hospitals. It then calculated the total number of available facilities within each geographic boundary and generated a normalized 1,192-dimensional feature vector at the zip code and county level.
③ Busyness dataset:For each point of interest category in the map data, the researchers calculated the sum of visits to the relevant places in these categories within a month to summarize the busyness of these categories.
④ Weather & Air Quality:The researchers collected weather and air quality data and summarized the hourly data for July 2022, describing it using mean, minimum, and maximum values. The full list of variables includes: mean sea level pressure, total cloud cover, U wind component at 10 m, V wind component at 10 m, temperature at 2 m, dew point temperature at 2 m, solar radiation, total precipitation rate, air quality index, carbon monoxide concentration, nitrogen dioxide concentration, ozone concentration, sulfur dioxide concentration, respirable particulate matter (<10 μm) concentration, fine particulate matter (<2.5 μm) concentration.
⑤ Remote Sensing:The researchers combined satellite image embeddings generated from the ViT16-L40 version of the SatCLIP model, indexed by the centroid of each ZIP code. The SatCLIP model is designed to be a universal geocoder for the entire world, and aggregates 100,000 tiles from Sentinel-2 satellite imagery from January 1, 2021 to May 17, 2023.
The researchers combined the dataset with a graph neural network (GNN) architecture to train a base model that generates embeddings that are general rather than task-specific.
Model architecture: Using GNN to solve geospatial problems efficiently and intuitively
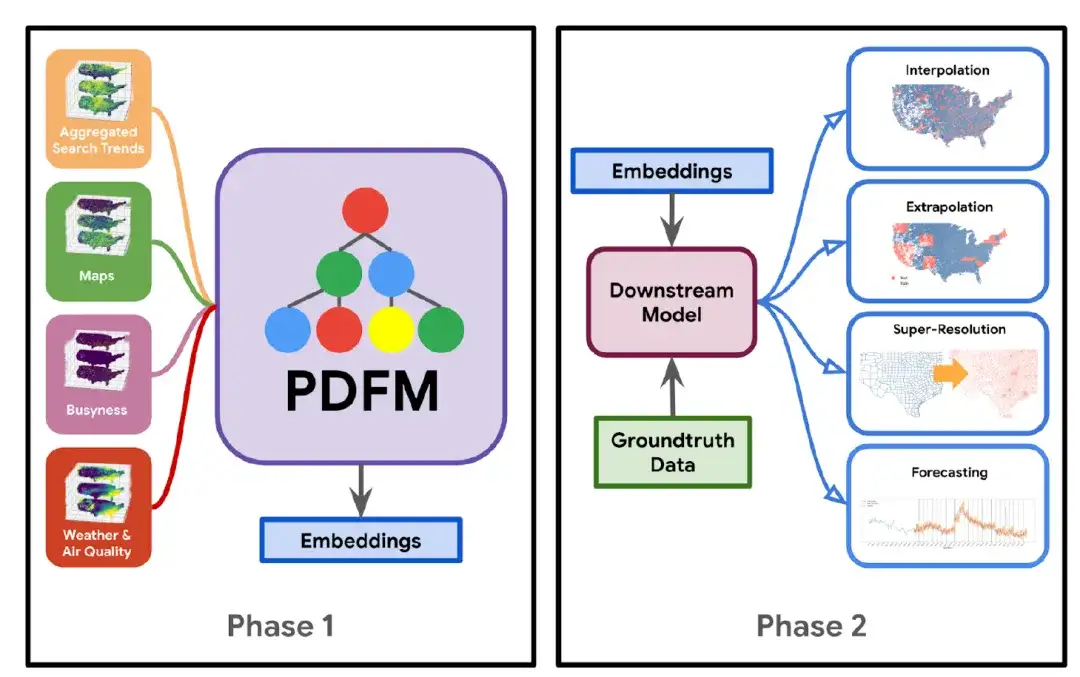
The construction of the PDFM model is shown in the figure below: In Phase 1,The researchers combined the dataset with the graph neural network (GNN) architecture to train a basic model that generates embeddings that are general rather than task-specific.In Phase 2,Using these embeddings and specific groundtruth data for the task at hand, a downstream model (such as linear regression, a simple multilayer perceptron, or a gradient boosted decision tree) is learned, which can be applied to a variety of tasks including interpolation, extrapolation, super-resolution, and forecasting.
* Interpolation task: refers to inferring and filling in the values of unknown data points based on the values of known data points
* Extrapolation tasks: Extrapolating existing data or experience to predict situations, trends or results beyond the current known scope
* Super-resolution task: refers to the process of upgrading low-resolution images or data to high-resolution through algorithms
Specifically, the core of the PDFM model is the Graph Neural Network (GNN), which encodes position embeddings into information-rich low-dimensional numerical vectors. It mainly consists of the following five parts:
* Graph construction:The researchers constructed a heterogeneous geospatial graph using counties and zip codes as nodes and establishing edges through neighbor relationships. The constructed geospatial graph has a homogeneous node set, treating zip code and county nodes as the same type of node set, and a heterogeneous edge set, with different edge types connecting the nodes.
* Sub-image sampling:Subgraph sampling is performed to create subgraphs for training large-scale GNNs and add randomness to the model. It starts from a seed node, traverses each edge set in a breadth-first manner, samples a fixed number of nodes in a weighted manner, and terminates when it reaches four hops.
Specifically, the researchers started from a seed node and traversed each edge set in a breadth-first manner, sampling a fixed number of nodes in a weighted manner and terminating when they reached a distance of four hops. This approach resulted in a subgraph with a number equal to the total number of zip code and county-level nodes.
* Preprocessing:Column-wise normalization is applied to all features, and the extreme ends of the feature value range are compressed by clipping.
* Modeling and training details:GraphSAGE (an inductive method) is used to learn node embeddings by leveraging node feature information. GraphSAGE learns a function to generate embeddings from local neighborhood aggregate information. For the aggregation architecture, the pooling architecture proposed in GraphSAGE is used, where the node states from the neighborhood nodes are passed through a fully connected layer with ReLU transformation, and the transformed old states and the neighborhood node states are further aggregated by element-wise summation. The researchers used the GraphSAGE architecture to facilitate one-shot message passing, and after the GNN layer, a linear layer of size 330 was added to encode the node-level representation into a compressed embedding.
* Hyperparameter tuning:The validation set is uniformly sampled from the seed nodes of 20% (including counties and zip codes) to form the tuning hyperparameters, including the dropout rate, the size of the node embeddings, the number of GraphSAGE hidden units and layers, the embedding size, regularization, and the learning rate.
Research results: Strong performance in interpolation, extrapolation, super-resolution and prediction tasks
PDFM is a flexible modeling framework that can address a variety of geospatial challenges across the continental U.S. By integrating diverse datasets, PDFM is embedded in 27 health, socioeconomic, and environmental tasks, outperforming existing state-of-the-art (SoTA) location encoding methods such as SatCLIP and GeoCLIP.
In interpolation tasks, PDFM outperforms on all 27 tasks, and in extrapolation and super-resolution tasks, it leads in 25. In addition, the researchers show how PDFM embeddings can enhance the performance of forecasting models such as TimesFM, thereby improving the prediction of important socioeconomic indicators such as county-level unemployment rates and zip code-level poverty rates.This highlights its broad application potential in research, social welfare, public and environmental health, and business.
The specific experimental results are as follows:
① Interpolation experiment
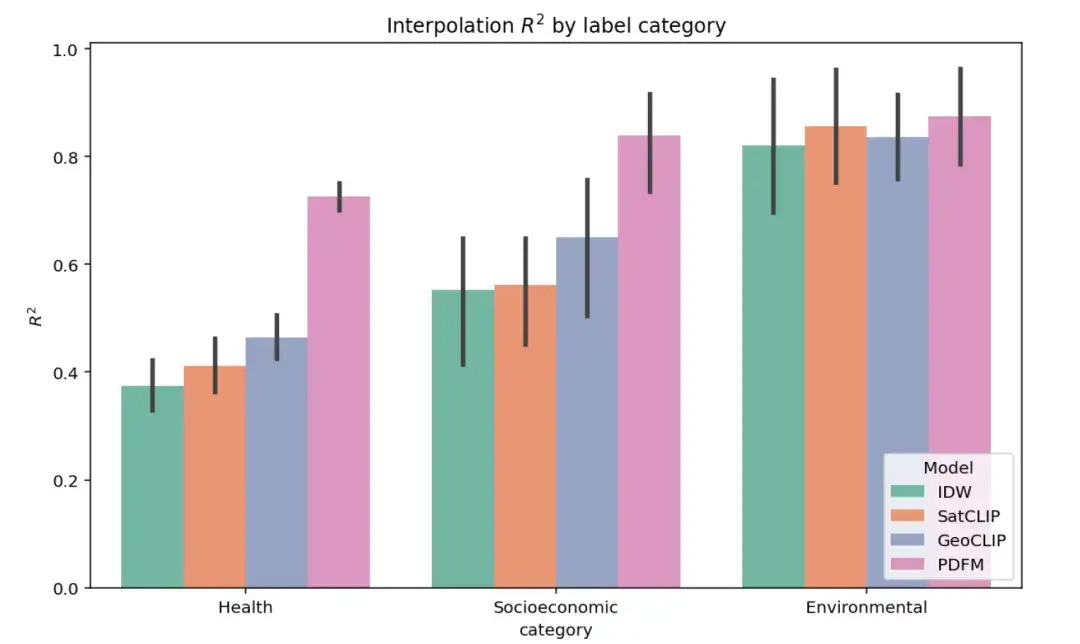
The figure below shows the results of the complete interpolation experiment on 27 tasks in three categories: health, socioeconomic category, and environmental. The performance of different models is evaluated using the ² indicator (a higher value indicates that the model better explains the variance of the target variable label). As shown in the figure, PDFM significantly outperforms SatCLIP and GeoCLIP in the socioeconomic and health task categories.
The table below shows how well PDFM interpolates 27 health, socioeconomic, and environmental tasks, such as Income, HomeValue, NightLights, PopulationDensity, TreeCover, Elevation, and Health (mean). PDFM consistently outperforms, with an average of 0.83 squared across all 27 tasks, including an average of 0.73 squared for 21 health-related tasks.
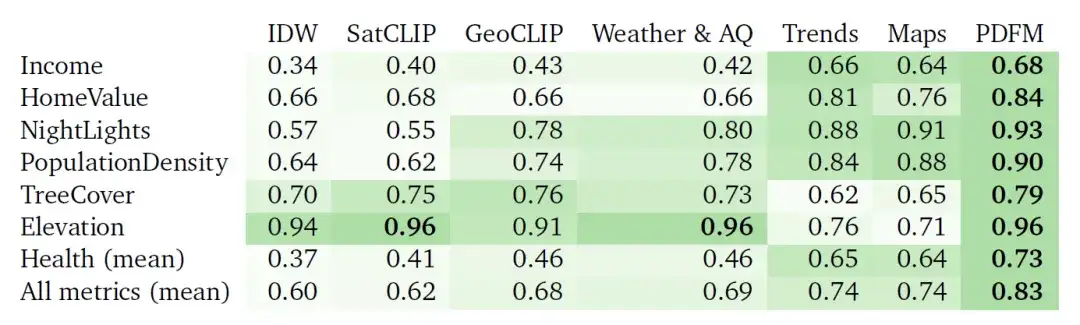
Table: Interpolation² results (higher values are better). These experiments compare the performance of inverse distance weighted (IDW) based interpolation, SatCLIP embedding, GeoCLIP embedding, PDFM embedding and its subcomponents (Weather & Air Quality, Aggregated Search Trends, Maps, and Busyness), using GBDT as downstream model.
② Extrapolation experiment
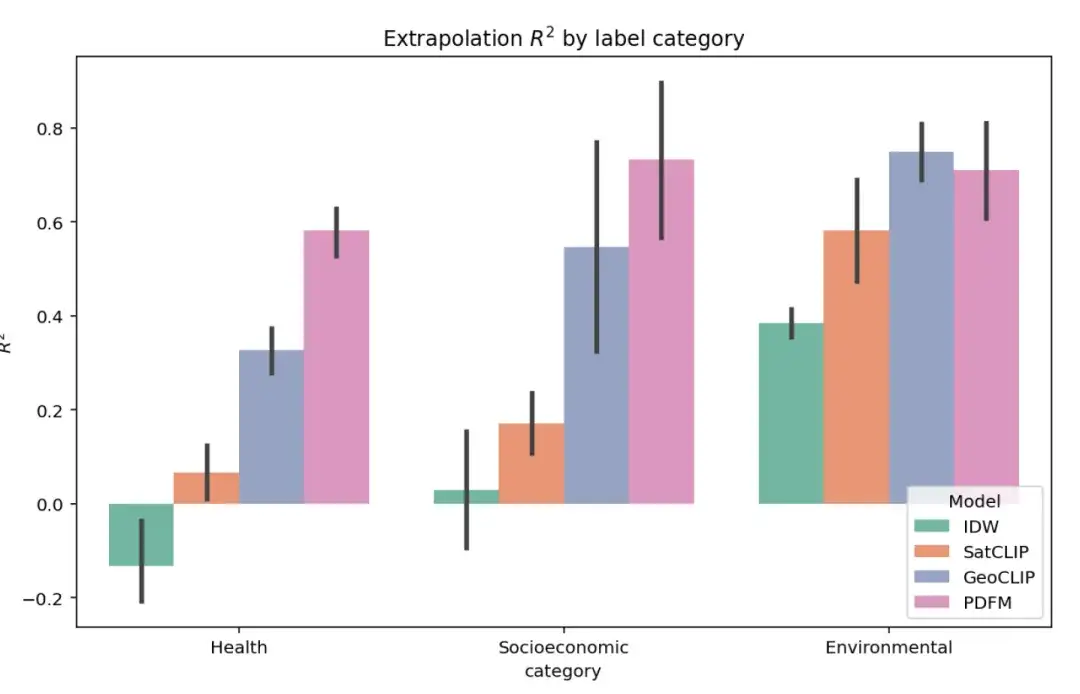
The figure below shows the complete extrapolation experiment results on 27 tasks in three categories: health, socioeconomic category, and environmental. The model performance is still evaluated using the ² indicator. As shown in the figure, although GeoCLIP has a slight advantage in dealing with environmental tasks, PDFM is significantly better than all other baseline models in predicting health and socioeconomic variables.
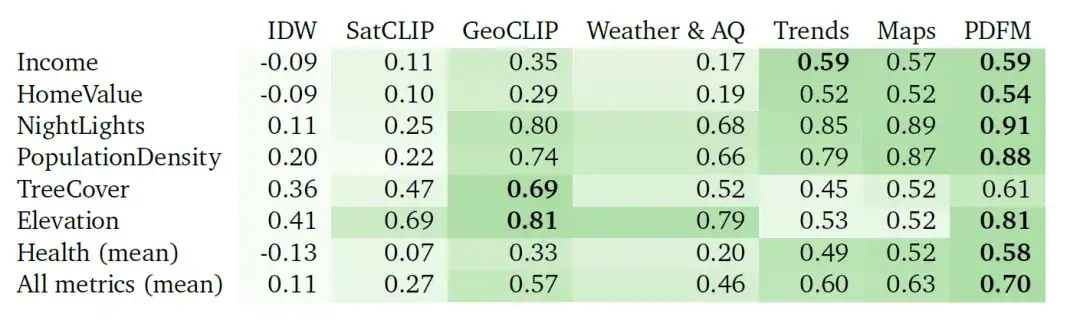
The extrapolation task is a challenging one due to the significant lack of labeled data. In this case, PDFM demonstrates excellent performance, as shown in the table below, with an average of ² = 0.70 on all metrics and ² = 0.58 for health-related metrics. Using geotagged images, GeoCLIP performs well in tree cover (TreeCover) prediction, achieving ² = 0.69, surpassing PDFM and any single modality. However, overall, PDFM surpasses the baseline model on 25 out of 27 tasks, highlighting its effectiveness in extrapolation scenarios.
③ Super-resolution experiment
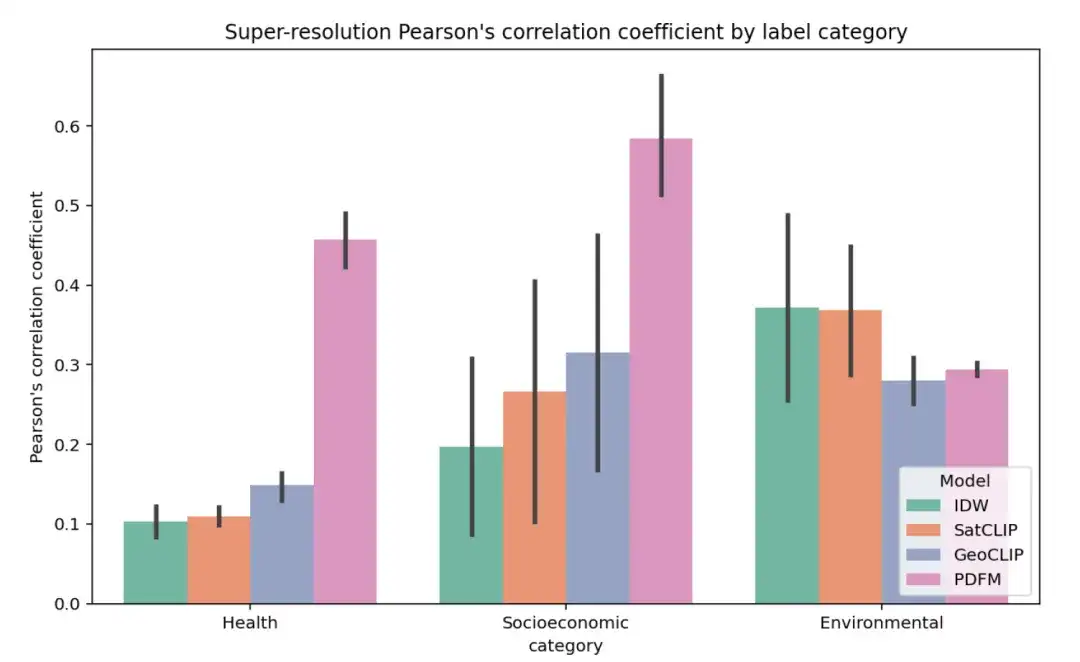
The figure below shows the complete results of the super-resolution experiment for 27 tasks, grouped by Health, Socioeconomic category, and Environmental, using the average Pearson correlation coefficient (r) within the county as the metric (higher values indicate that the model’s predictions are more correlated with the true labels at the zip code level).
The super-resolution task is more difficult. The results are summarized in the table below. IDW performs best in the elevation task, while GeoCLIP performs best in the tree cover task. Overall, PDFM performs well in 25 out of 27 tasks, with an average Pearson correlation coefficient of 0.48.
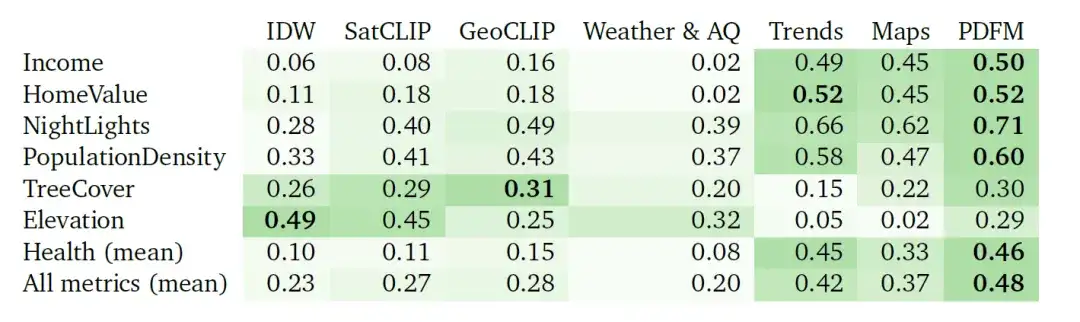
④ Prediction Task
The researchers also evaluated the effect of using PDFM embeddings to correct the forecast errors of TimesFM (a common univariate forecasting base model), with the main goal of evaluating the improvement of these embeddings in future periods (6-month unemployment rate forecast and two-year poverty rate forecast). The results in the table below show that the model combined with PDFM embeddings surpasses the baseline performance of TimesFM in terms of MAPE indicators and is also better than ARIMA - indicating that PDFM embeddings can significantly enhance the forecasting performance of TimesFM.
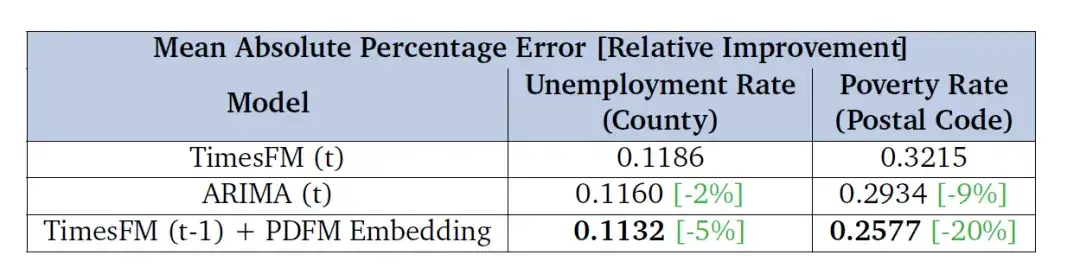
The researchers evaluated performance based on county-level unemployment rates and zip code-level poverty rates in the United States and presented the mean absolute percentage error (MAPE) in the table, with lower values indicating better performance.
Geospatial Artificial Intelligence (GeoAI) is booming
The birth of the PDFM model can be said to be another in-depth exploration and utilization of geospatial data. The so-called geospatial data usually involves a large amount of spatiotemporal data collected from many different sources in different formats, which can include census data, satellite images, weather data, mobile phone data, drawn images, and social media data. Sharing, analyzing and using geospatial data in a scientific way can provide many useful insights for the development of human society, such as predicting unemployment rates, housing prices, simulating the impact of a certain drug, or the migration of population after a disaster.
However, how to effectively process massive amounts of geospatial data is a challenge.With the emergence of artificial neural network models, the concept of geospatial artificial intelligence (GeoAI) came into being, and the industry has also made many explorations in this regard.
For example, in April 2024, in order to improve the interpretability of mineralization prediction models and the spatial non-stationarity caused by geological factors in the mineralization process, the research team of Zhejiang University proposed a new geospatial artificial intelligence method - geographically neural network-weighted logistic regression (GNNWLR). This model integrates spatial patterns and neural networks, combined with Shapley's additive interpretation theory, which can not only greatly improve the accuracy of predictions, but also improve the interpretability of mineral predictions in complex spatial scenarios.
In June 2024, researchers from the GIS Laboratory of Zhejiang University published a research paper titled "A neural network model to optimize the measure of spatial proximity in geographically weighted regression approach: a case study on house price in Wuhan" in the International Journal of Geographical Information Science, a well-known journal in the field of geographic information science. The paper innovatively introduced a neural network method to nonlinearly couple multiple spatial proximity measures (such as Euclidean distance, travel time, etc.) between observation points to obtain an optimized spatial proximity measure (OSP), thereby improving the accuracy of the model's prediction of housing prices. Through the study of simulated data sets and empirical cases of housing prices in Wuhan, the model proposed in the paper has been shown to have better global performance and can more accurately describe complex spatial processes and geographical phenomena.
Click to view detailed report: Accurately predict Wuhan housing prices! Zhejiang University GIS Laboratory proposes osp-GNNWR model: Accurately describe complex spatial processes and geographical phenomena
In the future, with the continuous development of AI technology, the geographic information industry will have a more solid technical foundation and more convenient development tools, thereby promoting mankind into the era of geographic spatial intelligence.
References:
1.https://arxiv.org/abs/2411.07207
2.https://research.google/blog/insights-into-population-dynamics-a-foundation-model-for-geospatial-inference/
3.https://www.ibm.com/cn-zh/topics/geospatial-data
4.https://mp.weixin.qq.com/s/eQz5N-cFTtGIkDk7IqMZxA
5.https://www.xinhuanet.com/science/2