Command Palette
Search for a command to run...
Published in Cell Journal! Research Group Led by Zhang Qiangfeng From Tsinghua University Developed SPACE Algorithm, Which Has the Best Organizational Module Discovery Capability Among Similar Tools
Although cells in multicellular organisms share the same genome, they show significant diversity in morphology, gene expression, and function due to differences in their internal gene regulatory networks and external signal exchanges with neighboring cells in the surrounding microenvironment. In order to associate cell type information with its spatial location within the tissue, spatial transcriptomics (ST) technology came into being.This technology can not only obtain high-resolution transcriptome data, but also correspond to positional information to determine the spatial distribution and positional relationship of different cell subtypes or transcriptional states. It plays a key role in re-understanding life structure, individual development, life evolution and defining diseases.
In recent years, with the continuous development of spatial transcriptomics technology, researchers can obtain the gene expression profile of cells at single-cell resolution while retaining the spatial location information of cells in tissues. How to effectively use this spatial information to identify spatial cell subtypes and discover tissue modules has become the core task of spatial transcriptome data analysis.
Currently, spatial transcriptome data analysis faces the following two challenges: First, for the identification of spatial cell types, many studies only use cell gene expression profiles and ignore the spatial location information of cells. Studies in recent years have shown that cell types that were originally considered homogeneous can be further subdivided into multiple subtypes based on their location in the tissue. Second, for the hairstyle of tissue modules, since the gene expression characteristics of different cells that make up the tissue may be highly heterogeneous, previous analysis methods have failed to fully utilize the heterogeneity of cell types in single-cell resolution spatial transcriptome data.
Based on this,Associate Professor Zhang Qiangfeng's research group at the School of Life Sciences, Tsinghua University/Structural Biology Advanced Innovation Center/Tsinghua-Peking University Joint Center for Life Sciences,A research paper titled "Tissue module discovery in single-cell resolution spatial transcriptomics data via cell-cell interaction-aware cell embedding" was recently published online in the journal Cell Systems.
The study developed an artificial intelligence algorithm SPACE (spatial transcriptomics data analysis via "interaction-aware" cell embedding) based on the graph autoencoder deep learning framework.The ability to identify spatial cell types and discover tissue modules from spatial transcriptome data at single-cell resolution can be used for large-scale spatial transcriptome studies.
Research highlights:
* Developed SPACE, an AI-based spatial transcriptome analysis tool that can identify spatial cell types and discover tissue modules from spatial transcriptome data at single-cell resolution
* SPACE significantly outperforms other tools in cell type identification and tissue module discovery, especially in complex tissues containing multiple cell types
* SPACE can be used for large-scale spatial transcriptome studies to understand how interactions between spatially neighboring cells affect the biological functions of cell types and tissue modules
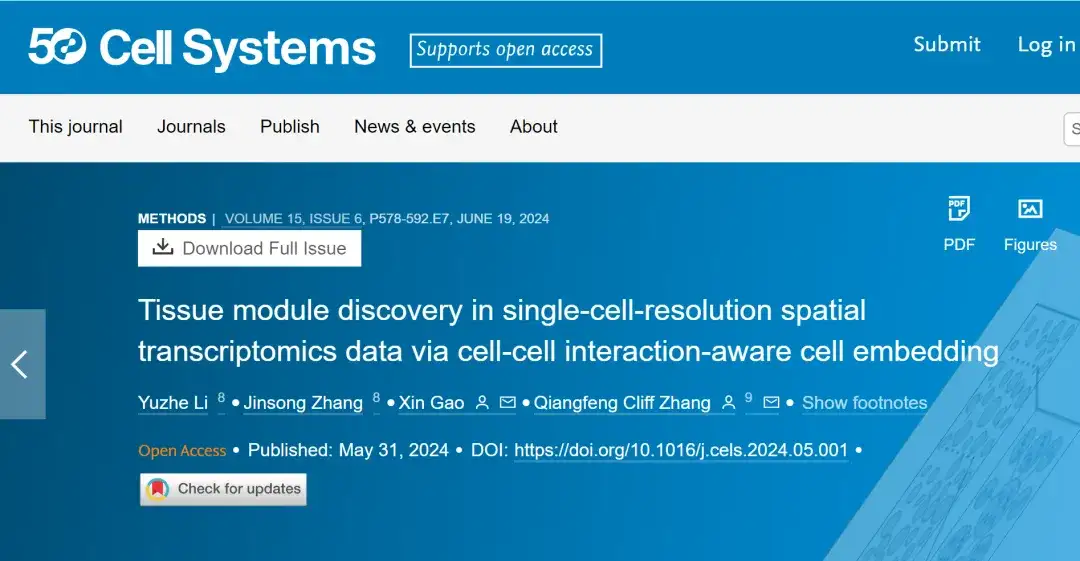
Paper address:
https://www.cell.com/cell-systems/fulltext/S2405-4712(24)00124-8
The open source project "awesome-ai4s" brings together more than 100 AI4S paper interpretations and provides massive data sets and tools:
https://github.com/hyperai/awesome-ai4s
Datasets: Multiple datasets verify SPACE capabilities
In order to verify the capabilities of SPACE, multiple datasets were used in the study, which are summarized as follows:
Dataset download address:
https://go.hyper.ai/CBJfX
MERFISH mouse PMC dataset
For the MERFISH mouse PMC dataset, the log-transformed normalized cell-gene matrix was obtained from the Brain Image Library, and cells labeled as “other” or located outside the main sample region were removed.
Dataset link:
STARmap Mouse PLA Dataset
For the STARmap mouse PLA dataset, the normalized cell-gene matrix was provided by the original paper and log-transformed.
Dataset link:
https://drive.google.com/file/d/1DDCowUuZ7PPFUSZsjvSqntWkYJMjf1Na/view?usp=sharing
MERFISH mouse AB dataset
For the MERFISH mouse AB dataset, the gene count matrix was obtained from the CELL x GENE library. The total counts per cell were normalized to 10,000, and the normalized cell-gene matrix was log-transformed.
Dataset link:
https://cellxgene.cziscience.com/collections/31937775-06024e52-a799-b6acdd2ba2e
MERFISH mouse WB dataset
For the MERFISH mouse WB dataset, the log-transformed normalized cell-gene matrix was obtained from the GitHub repository.
Dataset link:
https://github.com/AllenInstitute/abc_atlas_access
Xenium Human BC Dataset
For the Xenium human BC dataset, the gene count matrix was obtained from the 10x genomics website. The total counts per cell were normalized to 10,000, and the normalized cell-gene matrix was log-transformed.
Dataset link:
https://www.10xgenomics.com/products/xenium-in-situ/preview-dataset-human-breast
CosMx Human NSCLC Dataset
For the CosMx human NSCLC dataset, the log-transformed normalized cell-gene matrix was obtained from the nanoString website.
Dataset link:
https://nanostring.com/products/cosmx-spatial-molecular-imager/ffpe-dataset/nsclc-ffpe-dataset
Visium Human Brain Dataset
For the Visium human brain dataset, the gene count matrix was obtained using the Bioconductor package spatialLIBD. The top 3,000 highly variable genes were identified in each sample of the Visium human brain dataset using the scanpy.pp.highly_variable_genes() function (flavor = "seurat_v3") of the python package SCANPY (v1.9.1). The total counts of each cell were then normalized to 10,000, and the normalized cell-gene matrix was log-transformed.
Dataset link:
https://bioconductor.org/packages/release/data/experiment/html/spatialLIBD.html
Model architecture: A cell-cell interaction-aware cell-embedded model
SPACE uses a graph autoencoder framework to learn low-dimensional cell embeddings, which describe the gene expression information of each cell in the spatial transcriptome data and its interaction information with spatial neighboring cells (so the cell embedding is called cell-cell interaction-aware cell embedding). Based on this cell embedding, SPACE uses a clustering algorithm to identify spatial cell subtypes and discover tissue modules.
From the perspective of architecture,The SPACE model consists of three parts: encoder (three-layer graph attention network), neighbor graph decoder and gene expression decoder.The following figure shows the overall framework of the model:

First, SPACE constructs an adjacency graph by connecting each cell to its k nearest neighbor cells based on spatial proximity; then, SPACE uses a three-layer graph attention network (GAT) as an encoder to convert the gene expression profile input and the adjacency graph into low-dimensional cell representations, which are subsequently used to reconstruct the gene expression profile and adjacency graph of each cell through two independent decoder networks.
To train the GAE model, SPACE uses self-supervised learning, aiming to minimize the total reconstruction loss of gene expression profiles and adjacency graphs. The learned cell representations can then be used for cell type identification and tissue module discovery using various clustering algorithms.
Previously developed deep learning tools use graph convolutional networks (GCNs) (e.g., SpaGCN, SpaceFlow, GraphST, and SEDR) or graph attention autoencoders (e.g., STAGATE) to generate "neighborhood-aware" embeddings that discover tissue modules by aggregating the gene expression profiles of cells and their neighbors. SPACE differs from these tools in three main ways:
First, SPACE needs to reconstruct both gene expression profiles and adjacency graphs from the same low-dimensional cell representation (via two independent decoders).This design enables SPACE to remember the gene expression profiles and spatial interactions of the analyzed cell and its respective neighboring cells. In contrast, other methods take the adjacency graph as input but do not reconstruct the graph. To emphasize this distinction, this study calls the cell embeddings generated by SPACE "cell-cell interaction-aware cell embeddings."
Second, SPACE defines a receptive domain ratio to determine the relative weights of gene expression profile and adjacency graph reconstruction losses.This adjustable ratio enables SPACE to tailor the learning focus to specific research needs, emphasizing the gene expression profile of each analyzed cell or the interactions of spatially neighboring cells.
Third, SPACE also uses the attention mechanism in the GAT encoder to adaptively learn the weight of each neighborhood during the neighborhood information aggregation process.This approach automatically takes into account the respective contributions of different neighborhoods in the reconstruction of gene expression profiles.
Research results: SPACE outperforms other similar tools in cell type identification and tissue module discovery
SPACE was tested using multiple spatial transcriptome datasets, demonstrating that the cell communities discovered by SPACE were similar in spatial distribution characteristics to manually annotated tissue structures.
Assessing the ability of SPACE to identify spatially informative cell types
The study initially used a ST dataset of the mouse primary motor cortex (PMC) described by MERFISH (starting from slice 153) to investigate the ability of SPACE to identify cell types.The cell types identified by SPACE matched well with those reported in the original study.As shown in the figure below; in addition, SPACE also provides higher resolution cell type annotations for certain cell types (such as astrocytes and oligodendrocytes).
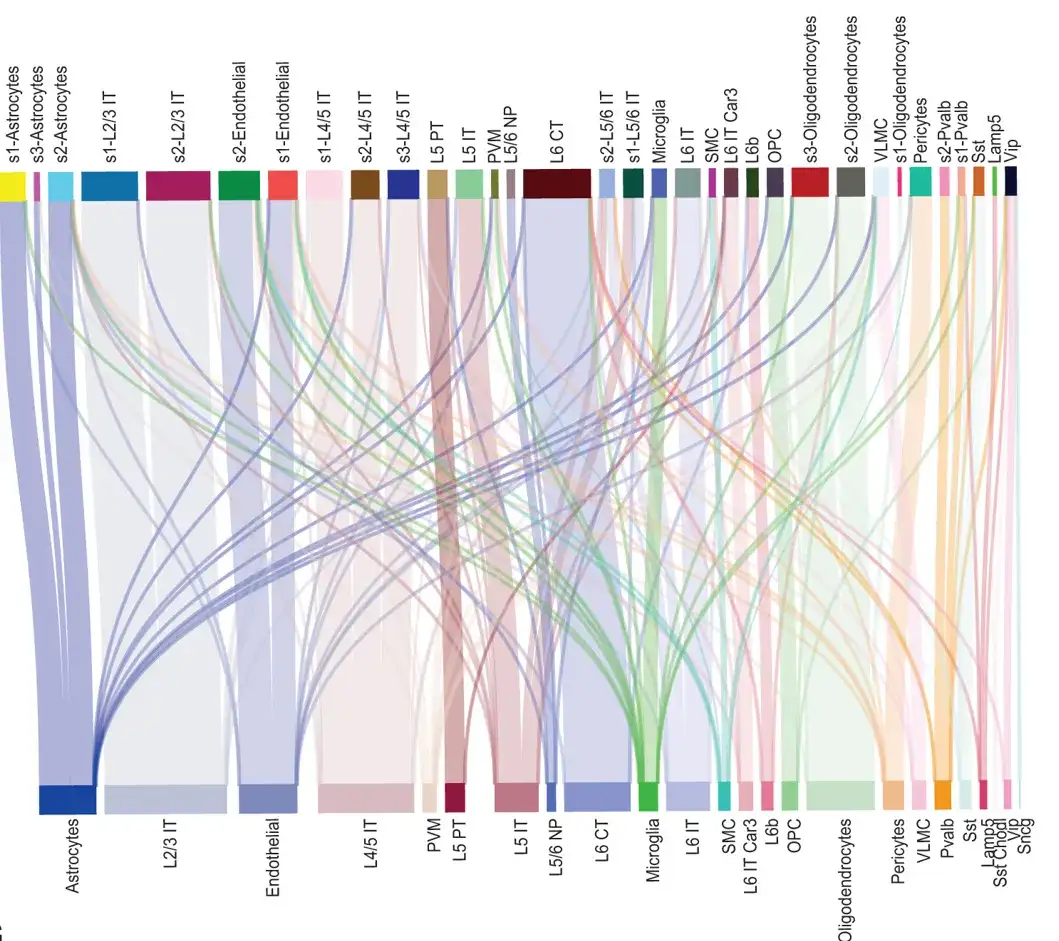
Sankey diagram showing the correspondence between the relevant cell types and the original cell types in the spatial information of all cells in the 153rd slice of the MERFISH mouse PMC dataset
The researchers then further focused on the identified subtypes of astrocytes (glial cells in the cortex) and oligodendrocytes (myelinating cells in the central nervous system). Astrocytes were once thought to be a homogenous cell type, but recent ST studies have reported that they have different functions in different brain regions.
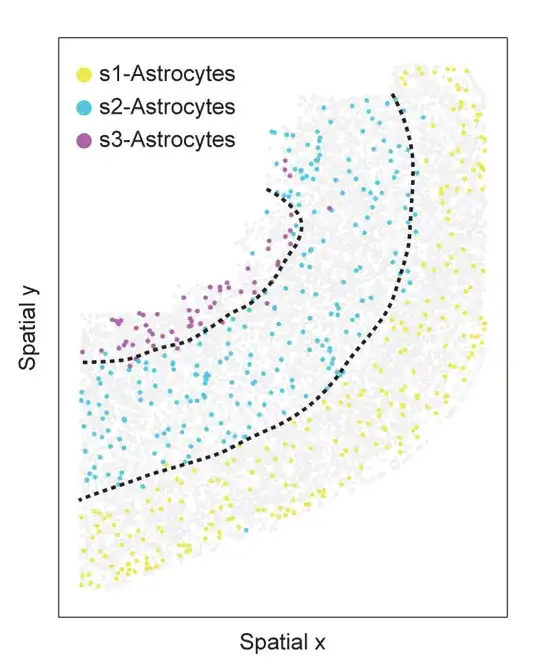
Spatial information of astrocyte subtypes in slice 153 of the MERFISH mouse PMC dataset. Cells are colored by astrocyte subtype, and light gray dots represent other cells. Dashed lines represent upper, deep, and white matter
In the experiment, SPACE found three different subtypes in PMC slices 153, as shown in the figure above, each subtype is spatially distributed in different cortical layers. Similar to astrocytes, SPACE also classifies oligodendrocytes into three spatially informative subtypes with different spatial distribution patterns.

The researchers also applied SPACE to a mouse placenta (PLA) dataset generated by another ST technology, STARmap. The results showed that SPACE annotated the cells into 16 cell types, which matched the cell types in the original study well, as shown above. SPACE identified two subtypes of glycotrophoblast cells, both of which were annotated as "giant trophoblast 2" cells in the original study. These two subtypes are located in different regions of the placenta and have unique neighboring interactive cell types.
In summary, the analysis of two independent datasets based on different ST methods and organizations supports the following conclusions:SPACE is able to identify biologically distinct cell types based on the spatial information in the ST dataset.
Evaluating the performance of SPACE in cell type identification
The researchers compared SPACE with two tools currently used to identify cell types from spatial transcriptomics data, BANKSY and FICT, which consider spatial information in addition to gene expression. In their analysis, the researchers also included SCANPY, a widely used tool for cell type identification, although it only considers gene expression.
For comparison, the researchers used the aforementioned MERFISH mouse PMC dataset and STARmap mouse PLA dataset. As shown in the figure below, SPACE can identify different spatial information astrocytes and oligodendrocyte subtypes, but SCANPY and FICT cannot define astrocytes and oligodendrocyte subtypes with cortical layer-resolved spatial distribution patterns.
For the STARmap mouse PLA dataset, although SPACE and BANKSY successfully identified the two glycotrophoblast subtypes, SCANPY and FICT failed to identify the glycotrophoblast subtypes, which may be due to the obvious differences in the surrounding cell types between the two glycotrophoblast subtypes.
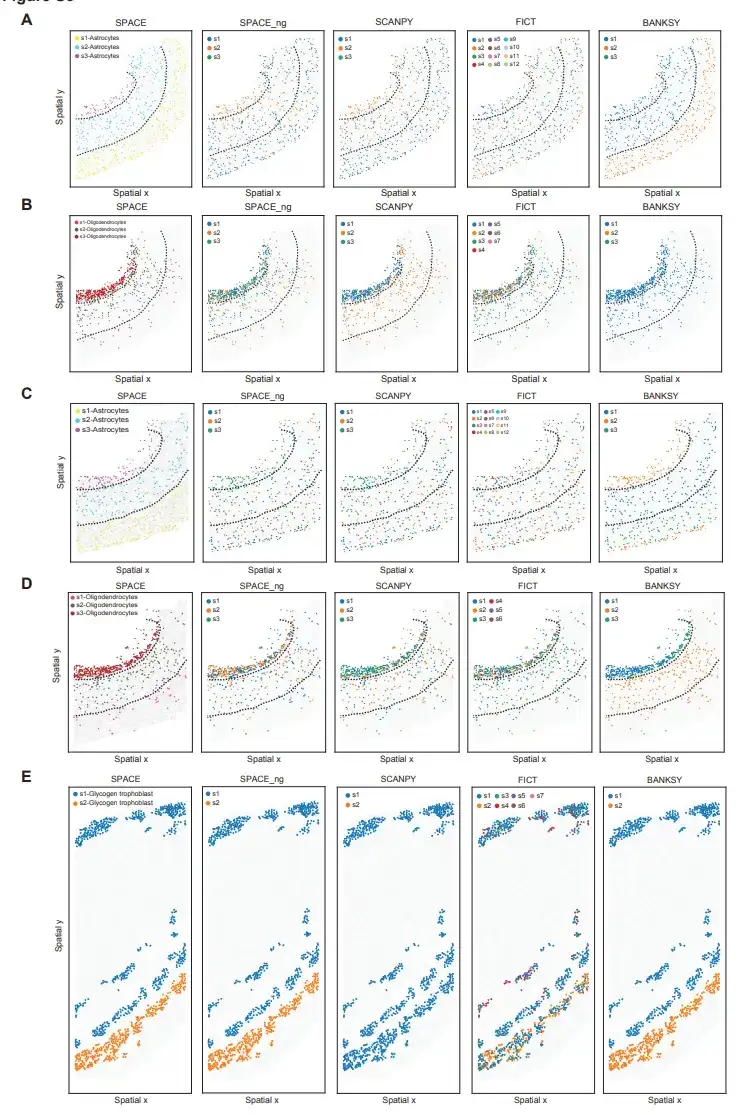
These results collectively indicate thatSPACE outperforms currently available tools for distinguishing spatially informative cell types from ST data.
SPACE outperforms state-of-the-art tools in tissue module discovery
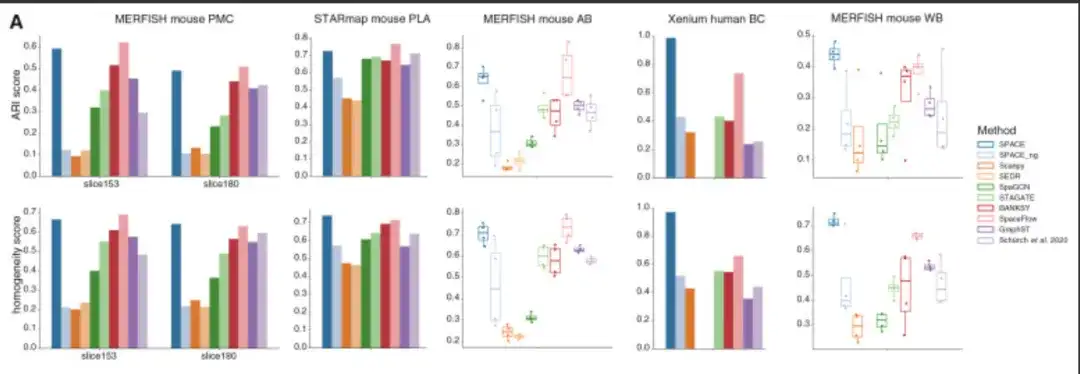
An important task in spatial transcriptomics research is to discover tissue modules in a given tissue. To evaluate the ability of SPACE in this regard, the researchers compared SPACE with SEDR, SpaGCN, STAGATE, BANKSY, SpaceFlow, GraphST, Schürch et al.'s method, as well as SCANPY and SPACE_ng, and used two of the aforementioned ST datasets (MERFISH mouse PMC dataset and STARmap mouse PLA dataset), as well as three additional datasets with annotated tissue modules, including the MERFISH mouse aged brain (AB) dataset, the MERFISH mouse whole brain (WB) dataset, and the Xenium human breast cancer (BC) dataset, which represent ST data obtained from different tissues and under different conditions.
Overall,SPACE outperforms competing tools by a wide margin in 2 of the 5 datasets and performs nearly on par with the best performing tools (relative to the respective best tools) in the other 3 datasets.As shown in the following figure:
Overcoming the challenges of spatial transcriptome data analysis
Spatial transcriptomics technology is one of the major breakthroughs in the field of bioinformatics in recent years and was named Technology of the Year by Nature Method in 2020.This technology makes up for the defect that single-cell sequencing technology has difficulty measuring the positional relationship between individual cells by simultaneously measuring the spatial positions of a large number of cells and the transcriptome counts within the cells, thereby providing a new data basis for understanding the interactions between multiple cells. Developing basic analysis methods for spatial transcriptome data is one of the current frontier issues in the field of bioinformatics.
The coupling of cellular spatial localization information and its molecular characteristic spectrum has produced a new type of multimodal high-throughput data resource, which poses many challenges to the development of efficient data analysis and information mining methods. Artificial intelligence provides new ideas for solving these challenges.
In July 2022, the research group of Professor Shen Hongbin and Associate Professor Yuan Ye from the Department of Automation, School of Electronic Information and Electrical Engineering, Shanghai Jiao Tong University published a research paper titled "Cell clustering for spatial transcriptomics data with graph neural networks" in Nature Computational Science, a Nature subsidiary.
Paper link:https://www.nature.com/articles/s43588-022-00266-5
The paper proposes a spatial transcriptome cell clustering method (Cell Clustering for Spatial Transcriptomics, CCST) based on graph convolutional neural network.It provides a new solution for processing spatial transcriptome data and has the potential to be applied to the research of multi-level basic problems in life and medical sciences, including modeling the spatial distribution of gene expression, analyzing cell dynamics, and discovering key cell subtype interactions and their molecular mechanisms.
April 2023A research team at Johns Hopkins University developed SpaceMarkers.This is a bioinformatics algorithm that can infer molecular changes in cell-cell interactions using latent space analysis of ST data. The researchers used this approach to infer molecular changes in tumor-immune interactions in metastatic, invasive, and precursor lesions, as well as immunotherapy-responsive Visium spatial transcriptomics data.
The study was published in Cell Systems under the title "Uncovering the spatial landscape of molecular interactions within the tumor microenvironment through latent spaces".
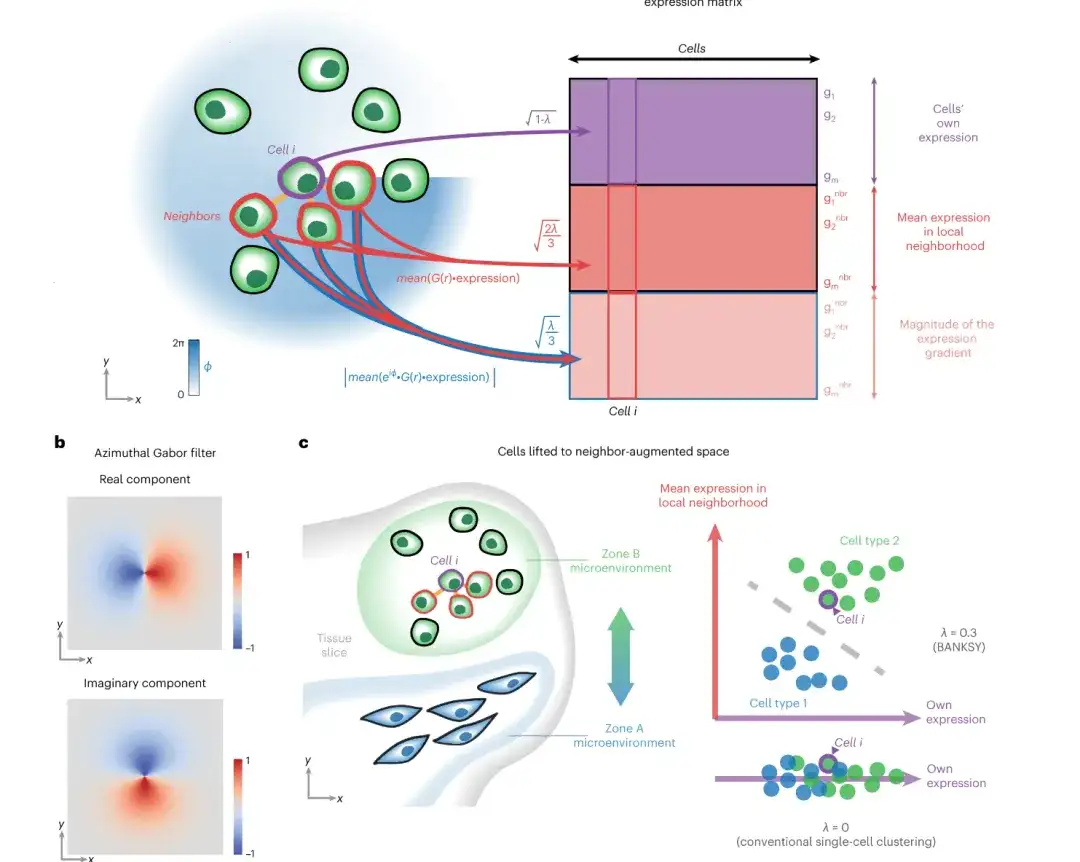
In April this year, a research report titled “BANKSY unifies cell typing and tissue domain segmentation for scalable spatial omics data analysis” was published in the international journal Nature Genetics.Scientists from A*STAR Research Institute in Singapore and other institutions reported an algorithm called BBANKSY (Building Aggregates with a Neighborhood Kernel and Spatial Yardstick).As an innovative spatial omics data analysis tool, the main function of this algorithm is to effectively classify cells in spatial omics data according to type and tissue domain.
Paper link:https://www.nature.com/articles/s41588-024-01664-3
Obviously, with the support of artificial intelligence technology in the future, spatial transcriptomics technology will better reveal the spatial distribution of various cell types in tissues, the interactions between various cell populations, and draw gene expression maps of different tissue regions, which has far-reaching application value for understanding the occurrence mechanism of diseases and cancers.
References:
1.https://www.cell.com/cell-systems/fulltext/S2405-4712(24)00124-8#secsectitle0030
2.https://www.tsinghua.edu.cn/info/1175/112190.htm
3.https://news.bioon.com/article/367a820e60b9.html
4.https://www.sohu.com/a/677912398_12
