Command Palette
Search for a command to run...
Accurately Predict Wuhan Housing Prices! Zhejiang University GIS Laboratory Proposes the Osp-gnnwr Model: Accurately Describing Complex Spatial Processes and Geographical Phenomena

Housing is an important part of human well-being and social development, and housing price fluctuations have received widespread attention from society. China is a country with a very wide geographical span. Even in the same jurisdiction of the same city, houses in different areas will have different housing prices due to differences in community environment, school districts, supporting businesses and other factors. Therefore, one of the hot topics in the study of housing prices is its spatial differentiation and influencing mechanism, which is the so-called "spatial heterogeneity".
In recent years, the spatial differences in housing prices have become increasingly significant, and a single distance measurement method is insufficient to capture the "spatial heterogeneity" of housing prices in a complex geographical environment. Especially in large cities like Wuhan, factors such as natural features (such as rivers and lakes) and urban infrastructure (such as bridges, tunnels, and multi-layer road networks) have a complex impact on housing prices.Traditional Geographically Weighted Regression (GWR) models face challenges in measuring spatial proximity.
In this context, researchers from the GIS Laboratory of Zhejiang University published a research paper titled "A neural network model to optimize the measure of spatial proximity in geographically weighted regression approach: a case study on house price in Wuhan" in the International Journal of Geographical Information Science, a well-known journal in the field of geographic information science.
This study innovatively introduced a neural network method to perform nonlinear coupling on multiple spatial proximity metrics (such as Euclidean distance, travel time, etc.) between observation points to obtain an optimized spatial proximity metric (OSP), thereby improving the accuracy of the model's prediction of housing prices.
To solve the problem that abstract "spatial proximity" cannot construct loss functions and neural networks are difficult to train,This study further combines OSP with the Geographically Neural Network Weighted Regression (GNNWR) method.The osp-GNNWR model was constructed to realize the training of neural network by solving the spatial non-stationary regression relationship between dependent variables and independent variables.
Research highlights:
- By introducing an optimized spatial proximity metric and integrating it into the neural network architecture, the applicability of geographically weighted regression in the study of spatial distribution of geographic processes such as housing prices is effectively improved.
- Through the study of simulated data sets and empirical cases of housing prices in Wuhan, the model proposed in the paper is proven to have better global performance and can more accurately describe complex spatial processes and geographical phenomena.
- This opens up new avenues for studying how to customize spatial proximity metrics to improve the performance of various geospatial regression models

Paper address:
https://www.tandfonline.com/doi/full/10.1080/13658816.2024.2343771
The open source project "awesome-ai4s" brings together more than 100 AI4S paper interpretations and also provides massive data sets and tools:
https://github.com/hyperai/awesome-ai4s
Dataset: Wuhan is used as a typical research area
Simulated Dataset
To evaluate the fitting accuracy of the osp-GNNWR model, the researchers generated a 64×64 spatial heterogeneity simulation dataset. The spatial heterogeneity of the simulated dataset is not only reflected in the straight-line distance, but also shows the spatial distribution characteristics defined by non-Euclidean distance, which can demonstrate the effectiveness of OSP.
Actual Dataset
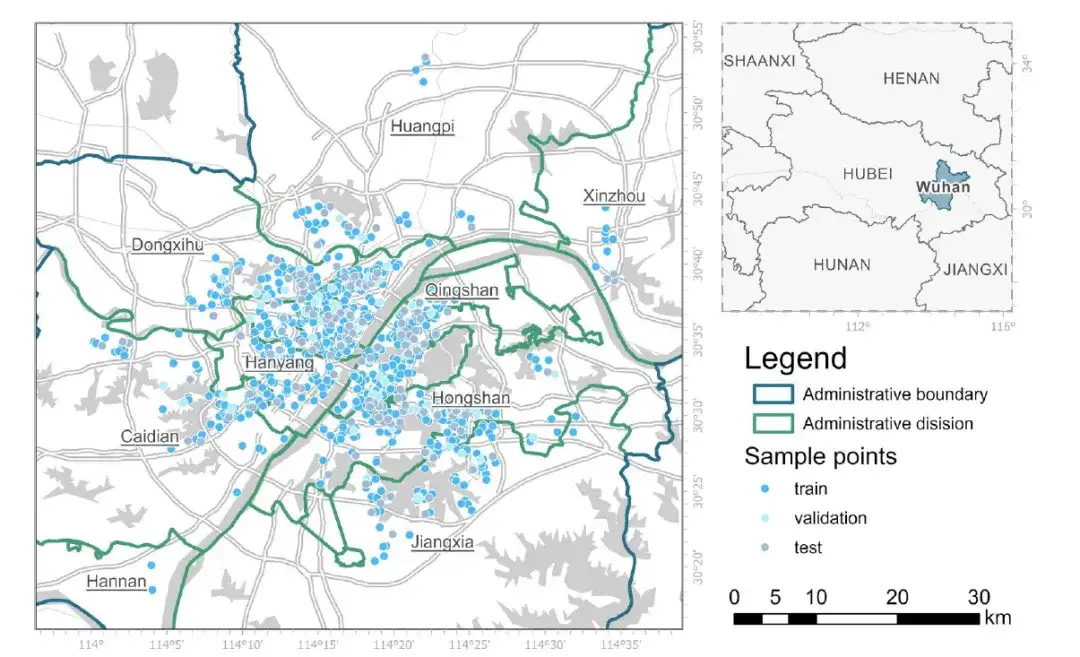
Wuhan, the capital of Hubei Province, is located in central China, at the confluence of the Han River and the Yangtze River. Wuhan has a humid subtropical climate, abundant rainfall, and numerous rivers, lakes, and ponds, which makes assessing spatial proximity challenging. As the largest and most densely populated city in central China, Wuhan also has a thriving real estate market, providing ample data for building a comprehensive model of Wuhan-specific real estate dynamics.

to this end,The researchers compiled a dataset containing 968 different real estate samples.These data come from the second-hand housing transaction records in Wuhan in 2019, and the data source is Anjuke (https://wuhan.anjuke.com). All these records were cleaned, special property types (such as villas) were excluded, and the data quality was guaranteed.
Model architecture: Introducing an optimized spatial proximity metric and integrating it into a neural network
The construction of the osp-GNNWR model is divided into two steps:
Step 1: Obtain the optimized spatial proximity measure (OSP)
In order to obtain more accurate spatial proximity measurements in complex geographic analysis, this study integrates multiple distance measurement methods, including Euclidean distance, Manhattan distance, and travel time, to optimize spatial proximity (OSP). In this way, the optimized spatial proximity measurement can better reflect the various influencing factors in complex spatial relationships, thereby improving the fit and explanatory power of the spatial regression model.
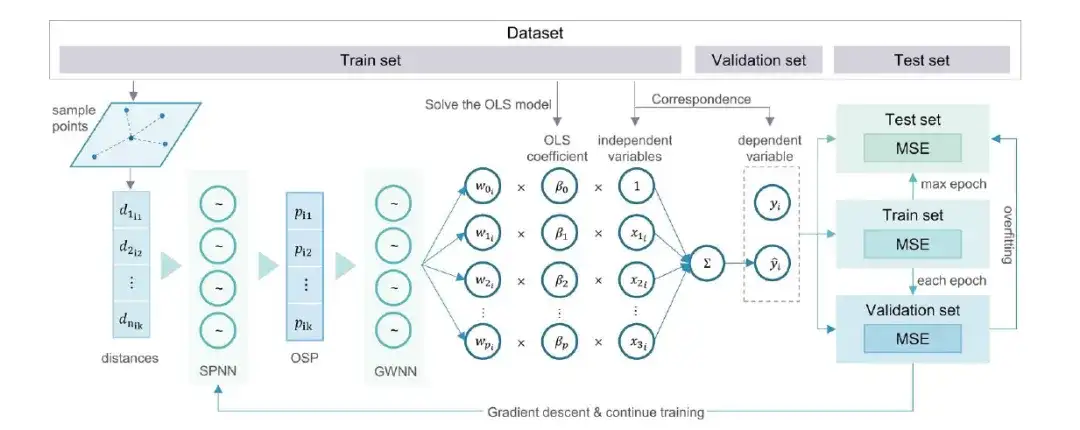
Step 2: Further combining OSP with GNNWR, the researchers proposed the osp-GNNWR model.As shown in the following figure:

Specifically, the training and validation procedures of the osp-GNNWR model are as follows:

Step 1:Extract dependent variables and independent variables for building regression models;
Step 2:The data set is randomly divided into a training set, a validation set, and a test set in appropriate proportions;
Step 3:Sample distances are calculated as spatial information in the osp-GNNWR model;
Step 4:Using input variables and spatial information, an osp-GNNWR model including network structure and hyperparameters is established;
Step 5:Get mini-batch data from the training set, train using the gradient descent algorithm, and evaluate the goodness of fit, such as using mean square error (MSE) as the loss function;
Step 6:Evaluate whether the current epoch is complete; if not, return to step 5.
Step 7:Evaluate the loss function on the validation set to determine if there is overfitting; if the loss is improved over the previous best result, retain the new superior model; otherwise, increase the overfitting tolerance count;
Step 8:Evaluate whether the overfitting tolerance or the maximum number of epochs (max epoch) has been reached; when the limit is reached, training stops and the test set is used to evaluate the latest superior model; otherwise, continue iterating from step 5.
Through the above steps, researchers can effectively train and validate the osp-GNNWR model to capture and explain the heterogeneity in complex spatial relationships and improve the accuracy and reliability of the model.
Research results: osp-GNNWR model has better global performance
First, let's look at the results of the analysis based on the simulated data set. On a set of simulated data sets based on Euclidean distance and Z-order distance, the researchers used models including OLS, GWR, GNNWR and osp-GNNWR for comparison. The results are shown in the following table:

- R²: A measure of how much of the change in one variable (dependent variable) can be explained by the change in one or more other variables (independent variables). This value is often used in linear regression analysis to assess the goodness of fit of a model. 0.% means that the model cannot explain any variation of the response variable around its mean, that is, there is almost no relationship between the model and the data; 100.% means that the model can explain all the variation of the response variable around its mean, that is, the model fits the data perfectly.
- RMSE (root mean square error): It is used to measure the deviation between the observed value and the true value. The smaller the value, the higher the prediction accuracy of the model.
- MSE (mean absolute error): used to measure the average absolute deviation between the model's predicted value and the actual value. The smaller the value, the higher the prediction accuracy of the model.
The osp-GNNWR model has higher R², lower RMSE and lower MSE values on both the training and test datasets, thus showing better performance. These simulation results prove that the SPNN network used in the osp-GNNWR model has excellent generalization ability and highly accurate fitting effect when processing input distance. Therefore, compared with the traditional method that only relies on Euclidean distance,The osp-GNNWR model has potential advantages in depicting the spatial heterogeneity of real-world geographic processes.
Next is the performance of the osp-GNNWR model based on the actual Wuhan housing price data. The following table shows the performance comparison results of the OLS, GWR, GNNWR and osp-GNNWR models:

Similarly, the osp-GNNWR model has higher R², lower RMSE value, and lower MSE value on both the training and test datasets, thus showing better performance.
It is worth noting that compared with GNNWR(TD), the osp-GNNWR model improves the R² of the test dataset from 0.737 to 0.793, and reduces the RMSE from 0.168 to 0.149 and the MAE from 0.125 to 0.109. These results show thatThe integration of OSP improves the fitting and prediction performance of the osp-GNNWR model.making it the most effective approach among the models studied.
- GNNWR(TD): GNNWR model using travel time as proximity measure.
Specifically, in areas with complex natural landscapes and infrastructure, such as the west bank of Tangxun Lake in Jiangxia District, the shore of Hougong Lake in Caidian District, and the confluence of the Han River and the Yangtze River, and in emerging development zones such as Hongshan District and Xinzhou District where the highway network is well developed and the difference between actual spatial proximity and physical distance is large,The residual of the osp-GNNWR model is significantly smaller than that of other models, showing higher prediction accuracy.
Overall, the findings of this study highlight the effectiveness of OSP in enhancing the ability of the osp-GNNWR model to represent spatial heterogeneity, thereby advancing the modeling of complex spatial relationships within real estate markets.
Deep learning helps with complex housing price prediction problems
Exploring the causes and influencing mechanisms of spatial differentiation of housing prices is of great significance to maintaining the stable development of the real estate market and improving urban planning and residential satisfaction. However, housing price prediction is a very complex issue involving many factors, such as geographical location, transportation convenience, school district, house age, house type, etc. Traditional methods are usually based on statistics and machine learning, but these methods are difficult to cope with as the scale and complexity of data increase. Deep learning has powerful feature learning and classification capabilities, which can better handle such problems.
In order to improve the accuracy of house price prediction, the industry's research is mainly carried out in the following directions:
One is the mixed model approach.That is, combining deep learning and traditional machine learning methods to give full play to their respective advantages. For example, deep learning can be combined with traditional machine learning methods such as support vector machines (SVM) or random forests to build a hybrid model for house price prediction.
The second is to consider time series data.That is, in housing price prediction, in addition to considering the static properties of the house, time series data can also be considered, such as historical housing prices, economic indicators, etc., and methods such as recurrent neural networks (RNN) can be used for analysis and prediction.

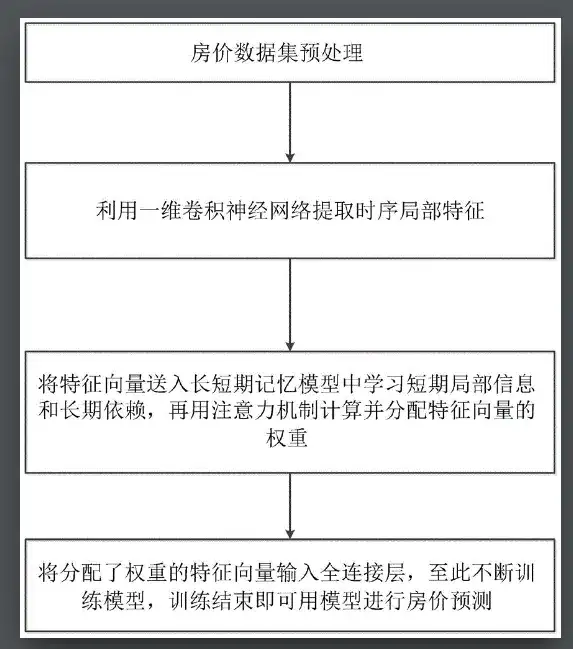
For example,Some researchers introduced a convolutional time series house price prediction method based on attention mechanism in Google patents.The researchers first preprocessed the housing price dataset and obtained a time-series of multidimensional factors related to housing prices.
Taking into account the multi-dimensional related factors that affect house prices, the fluctuations and impacts on house price trends, a convolutional time series neural network based on the attention mechanism is used to predict house prices. A one-dimensional convolutional neural network is used to process the features of the multi-dimensional related factors to obtain a multi-dimensional feature vector after further feature extraction and dimensionality reduction. The feature vector is then input into the long short-term memory model to learn the long-term overall trend and short-term local dependency information between features.
This method combines the long-term overall trend and short-term local information of house price time series forecasting, reduces the variance of house price forecasting, and improves the generalization ability of house price forecasting methods based on multi-dimensional time series data.
The third is the application of Geographic Information System (GIS).Combine deep learning with geographic information systems (GIS) to analyze the impact of factors such as geographical location on housing prices and improve the prediction accuracy of the model - the osp-GNNWR model mentioned above is a typical example.
With the support of AI, the housing price prediction model will become more reliable and accurate. Based on this, real estate companies can reduce investment risks; the government can fully and accurately control housing information, so as to carry out targeted management and jointly create a good real estate environment to help the people truly live and work in peace and contentment.
References:
1.https://www.tandfonline.com/doi/full/10.1080/13658816.2024.2343771
2.https://mp.weixin.qq.com/s/P4nk5sl2v60Q5DeVrOfWLw
3.https://cloud.baidu.com/article/1892933
4.https://patents.google.com/pate


