Command Palette
Search for a command to run...
The University of Tokyo Uses AI and Drones to Predict the Best Harvest Date for Crops, Which Can Recover up to 20% of Losses!
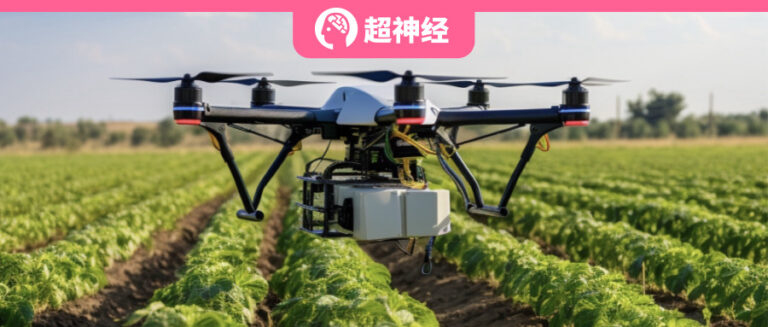
Contents at a glance:If the growth conditions of all crops in the field can be determined and predicted in a short period of time, the optimal harvest date can be set, the number of non-standard size crops can be reduced, and income losses can be minimized. In response to this, researchers from the University of Tokyo and Chiba University have proposed an AI + drone solution.
Keywords:Agriculture Drone Remote Sensing Imagery
Author | Li Baozhu
Editor | Sanyang, Xuecai
In spring ploughing, in summer weeding, in autumn harvesting, and in winter storing, the four are done at the right times, so that the five grains are never exhausted and the people have surplus food.
For a long time, people have been following the experience passed down over the years to work hard and harvest crops according to the general maturity cycle. However, due to different growth conditions, there are inevitably some differences in the quality, size, and maturity of crops at harvest time. Uniform mechanized harvesting will waste a lot of crops that do not meet the standards for sale or consumption, resulting in reduced profits. Therefore,The harvest date is critical to the percentage of the crop that fails to meet standards and the farmer’s final total income.
As drones fly over the fields, people are beginning to explore how to predict the best harvest date based on drone aerial image data.Researchers from the University of Tokyo and Chiba University have developed a systematic process for collecting plant phenotypic data using drones.Based on drone remote sensing and image analysis, the size of each broccoli head is predicted and the data is fed into a temperature-based growth model to predict the optimal harvest date.
After two years of field application experiments, the system has accurately estimated the size of broccoli heads and successfully predicted the best harvest date based on relevant data, which can reduce farming losses and increase profits. Currently, the relevant results have been published in "Plant Phenomics".
This result has been published in "Plant Phenomics"
Paper link:
https://spj.science.org/doi/10.34133/plantphenomics.0086#body-ref-B4
01 Growth model + price data:6 Steps to Generate a Profit Forecast Model
Taking broccoli as an example, the research team used drones to obtain the head size information (geometric features) of all broccoli heads at different times during the broccoli growth period. They then established a simple growth model between the head size and temperature data, and combined it with the price data obtained through market surveys to establish a profit prediction model for the optimal harvest date.

This method mainly includes 6 key steps
Step 1: Drone Flight to get the original image
* Experiment time:2020-2021
* Experimental location:Experimental Farm, Institute for Sustainable Agriculture and Ecosystem Services (ISAS), Tokyo, Japan
* Aerial photography equipment:DJI Mavic 2 Pro and DJI Phantom 4 RTK
* Image data:224 GB (2020) + 72 GB (2021)
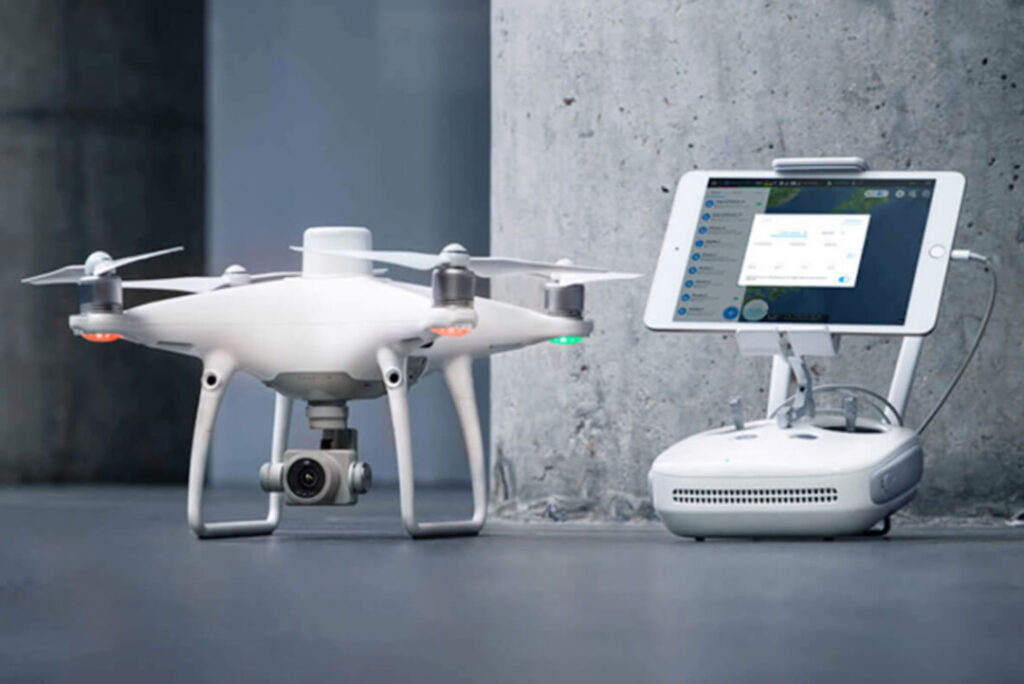
DJI Phantom 4 RTK, Image source: DJI official website
Step 2: Aerial Image Preprocessing (Photogrammetry)
The researchers used Pix4DMapper Pro, a professional drone image processing software, to measure drone images and pre-process the image data through 3D reconstruction. Using the default software parameters,Digital orthomaps (DOM) and digital surface models (DSM) were generated.
The computer configuration used for 3D reconstruction is as follows:
Intel i9-7980XE CPU 2.6GHz, 64GB RAM, 2 NVIDIA GeForce GTX 1080Ti GPU
Step 3: Seedling detection
Detection algorithm: YOLO v5, NMS algorithm
Note: NMS algorithm full name nonmaximum suppression, non-maximum suppression algorithm
At the seedling stage, the researchers used YOLO v5 to detect the position of broccoli heads and used the NMS algorithm to merge repeated detection results within the buffer area.
The center point of the bounding box was then considered the location of the broccoli, and the detection results were manually checked and adjusted in the open source geographic information system Quantum GIS to ensure that no detections were missed or duplicated.

Broccoli seedling testing workflow
Step 4: Head segmentation
Segmentation model: BiSeNet v2

Broccoli head cutting process
During the experiment, in order to reduce the workload of deep learning data annotation and processing and eliminate the influence of some soil and weeds,The researchers used time series data fusion as a guide.The processing area was reduced and only a square area around the seedling (approximately 100 × 100 pixels, slightly larger than the broccoli head) was used for broccoli head segmentation.
also,The researchers also used interactive annotation to reduce the workload of data annotation.
Note: Interactive annotation refers to the use of an intelligent, algorithm-based method to select annotation samples to maximize deep learning model performance and reduce annotation costs.
The researchers used the open source image annotation tool LabelMe.The segmentation model was trained on a small amount of initial training data that was manually labeled. Images were then randomly selected and applied to the segmentation results, which were converted to LabelMe JSON format using a Python script, and the labels for the new training data were manually adjusted.
This process is repeated until the segmentation result does not need to be adjusted.
Step 5: Generate a growth model to predict the size of the broccoli head (Size calculation)
Prediction Model: Nonlinear regression model used to predict broccoli head length (HD) over time

T is the sum of daily average temperatures, with a lower limit of 0°C and an upper limit of 20°C
a, b and c are the parameters to be determined
Step 6: Generate profit forecast model
Based on market price surveys and combined with growth models, a profit forecast model is generated.
02 Two years of field experiments, segmentation model performs well
When preparing the training data, we consider the obvious difference between green broccoli plants and brown soil.The researchers only selected 2 representative sectors as training images.

2020 Broccoli Seedling Position Detection Example (AF)
Head Segmentation Instances (GI) via Interactive Annotation
As a starting data training, the researchers randomly selected an aerial image from 2020 and annotated about 5 broccoli heads in it as simply as possible, as shown in the GI figure above, and trained the BiSeNet model (v0) with these annotations.
Subsequently, the v0 model was applied to randomly selected images from each aerial survey, and the researchers manually adjusted the analysis results and saved them as new training data for the v1 model. This step was repeated iteratively until the model achieved better segmentation results, thus forming the v2 model.
After 4 iterations, the model performance was greatly improved, reaching an intermediate IoU (Intersection over Union) of 88.33 %.
In addition, to verify the accuracy of drone measurements of HD, the researchers compared the results with on-site manual measurement data.
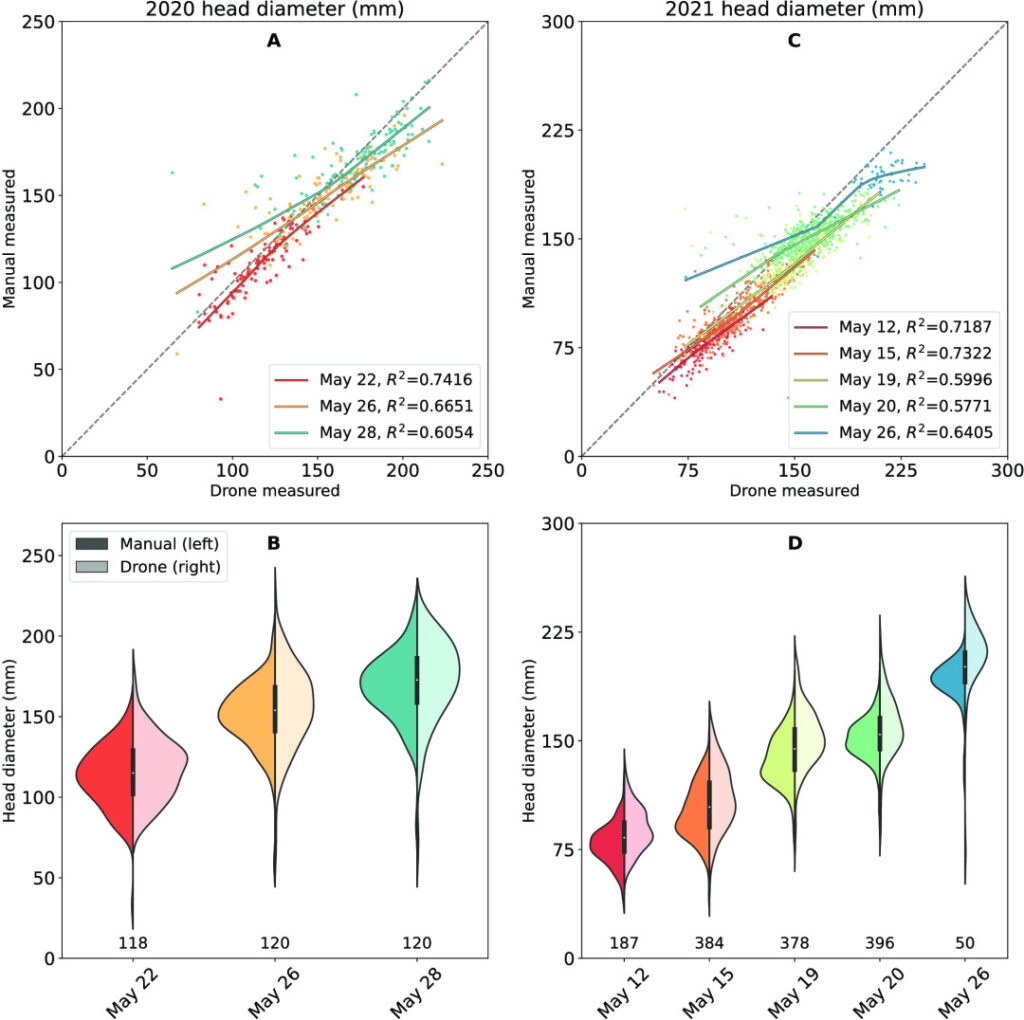
Comparison of drone measurement data with manual field measurement data
The results showed that the overall distribution of broccoli head size data was almost identical between the two, with a coefficient of determination R²≥0.57.Overall, UAV-based measurements were able to accurately characterize the high-definition distribution of broccoli across the field.
03 Predicting the best harvest date based on nonlinear regression model
The researchers initiated drone-based measurements when the flower head diameter (HD) was approximately 3-3.5 cm.
As shown in the figure below, to obtain the normalized temperature T(0) for the first flight (HD is about 9.5 cm), the researchers inverted the previous model to calculate T(0) from the HD data. The daily temperature (Ti) was then calculated for the subsequent days (i) and finally the model was regressed.
Based on this model, the researchers calculated broccoli head size after the first aerial survey using T as it varied over time.

Illustration of the data processing for the broccoli head size prediction model
All figures are examples only and are not actual results.
A: Field-measured diameters on different dates; the light color is used as the starting date, the size of the broccoli head is about 3-3.5 cm. T is the sum of the daily mean temperatures. ΔTi is the total temperature deviation.
B: Reshape the previous table into a 2-column table for use in the regression analysis shown in C.
D: The previous regression model is used to initialize T from HD. T on subsequent days is added with the deviation ΔTi.
E: Use the previous data for the regression prediction model from T to HD.
Income was calculated using the flower head diameter (HD) predicted by drones, and the number of individuals per size standard was counted on each date.
Finally, total revenue for each harvest date was calculated by multiplying the quantity and shipping price for each size class.The date with the highest income is selected as the optimal harvest date.
04 A slight difference in harvest date can lead to huge difference in profits for vegetable farmers
Based on the initialization and prediction models, the research team calculated the distribution of all broccoli sizes during the harvest period and then calculated the proportion of non-standard-sized broccoli and the total revenue for all dates.
In the 2020 experiment, May 23 was the optimal harvest date, the date when the proportion of non-standard-sized broccoli was minimized and total revenue was maximized. In the 2021 trial, May 17 was determined to be the optimal harvest date.
At the same time, the researchers found that a harvest time deviation of 1 day from the optimal date could result in a considerable loss of income - a reduction of 3.7% to 20.4%.

Forecasted HD distribution in the 2020 and 2021 trials, as well as the proportion of non-standard-sized broccoli and total revenue, with orange and yellow being the optimal harvest date
In addition, this study showed thatThe proportion of nonstandard-sized broccoli and total revenue changed rapidly with harvest date.For example, picking 1 day earlier or later than the best-harvest date would increase the amount of nonstandard-sized broccoli by about 5% and reduce total revenue by about 20%, while picking 2 days later than the best-harvest date would increase the amount of nonstandard-sized broccoli by about 15% and reduce total profit by about 40%.
05 Intelligent technology reforms traditional labor model
"Food is the primary need of the people, and agriculture is the source of food." The importance of agriculture to human society needs no elaboration. At the same time, as an important pillar of social and economic development, agriculture is also one of the earliest industries to engage in intelligent upgrading.Various types of farmland detection systems, intelligent irrigation equipment, and unmanned harvesting equipment have begun working hard in the fields.
Focusing on the application of drones in agriculture, with the continuous development of technologies such as 5G, machine vision, and big data, they have also entered the homes of ordinary people.
Initially, drones were mainly used for plant protection work, and their more efficient and uniform fertilization and spraying greatly saved manpower and time costs. Later, as aerial photography technology became more mature and costs dropped, it also created more sparks in agriculture. Applications such as drone-based farmland inspection and crop growth visualization have become the highlights of the new agriculture.
It is foreseeable thatAs AI-related technologies continue to be implemented, more advanced results will move out of the laboratory and into the farmland, improving the working mode of "facing the earth and back to the sky".
Reference Links:
[1]https://spj.science.org/doi/10.34133/plantphenomics.0086#body-ref-B4
