Command Palette
Search for a command to run...
Li Song's Research Group at Huazhong University of Science and Technology Used Machine Learning to Predict Water Adsorption Isotherms of Porous Materials

The water adsorption isotherm of porous materials is a very important parameter, but it is not easy to obtain this parameter. This is because there are too many types of porous materials and their structures are diverse. It is too costly and time-consuming to obtain water adsorption isotherm data through experiments and calculations.
Li Song's research group at Huazhong University of Science and Technology established a two-step machine learning model to train AI to predict water adsorption isotherm parameters and subsequent application performance based on the structural parameters of the material.
Author|Jia Ling
Edited by Xuecai, Li Hui, Sanyang
Porous materials have a huge range of applications in water purification, water desalination, water collection, and adsorption heat conversion. In these adsorption-driven applications, structural properties such as surface hydrophilicity, desorption hysteresis, and water absorption may affect the performance of porous materials. These structural properties can be obtained from water adsorption isotherms.
So, how to obtain the water adsorption isotherm of a material?
It is not difficult to obtain the water adsorption isotherms of several adsorbents experimentally, but there are many types of porous materials. For example, the Cambridge Structural Database has recorded data on more than 100,000 porous materials. It is obviously unreasonable to synthesize and test them one by one.
If the water adsorption isotherm is obtained by computational means, through molecular simulation of the adsorbent crystal structure, the computational cost is extremely high and it is difficult to predict on a large scale.
Machine learning can summarize and process large amounts of data and extract patterns from them, and it has certain application cases in the prediction of material properties.Based on this, Li Song's research group from Huazhong University of Science and Technology established a machine learning model, trained AI to extract the structural parameters of porous materials to predict water adsorption isotherms, and on this basis further estimated the cooling performance and subsequent applications of various adsorbents.
The results have been published in the journal "Journal of Materials Chemistry A"
Paper link:
https://pubs.rsc.org/en/content/articlelanding/2023/TA/D3TA03586G
01 Experimental procedures
Dataset:EWAID database
The researchers selected 460 nanoporous adsorbents from the EWAID version 3.0 water adsorption isotherm database.Including metal-organic frameworks (MOFs), covalent organic frameworks (COFs) and zeolites with defined crystal structures, their water adsorption isotherm data were obtained through literature research.
EWAID:experimental water adsorption isotherm database
Among the 460 selected adsorbents, 148 possessed all structural features, and the relevant structural parameters were accessible surface area (Sa), effective pore volume (Va) and pore diameter (Dp).
The universal adsorption isotherm model (UAIM) was used to fit the water adsorption isotherms of 148 adsorbents, and the water absorption (W) of the materials at 298K under different pressures (P) was obtained.
The structural characteristics and adsorption performance data (Sa, Va, Dp, P and W) of the adsorbent were input into the machine learning model for training.

Selected adsorbents from EWAID
Model Architecture:Two-step ML strategy
The researchers developed a two-step ML strategy:
The structural parameters (Sa, Va, Dp) and adsorption pressure P of porous materials were extracted from the database as parameters and input into the ML: SI model to predict the water adsorption isotherm using machine learning.
After estimating the water adsorption isotherm, three parameters were extracted: saturated adsorption capacity (Wsat), the step position of the isotherm (α) and the Henry constant (KH) and input the ML:IP model. Calculate the coefficient of performance (COP) of the adsorption refrigeration systemC, the coefficient of performance for cooling) and the specific cooling effects (SCE) of the adsorbent/water working fluid pair were used to evaluate the adsorption cooling performance.

Schematic diagram of a two-step machine learning strategy
Algorithm training:Comprehensive application of RF and ANN
The Scikit-learn module was used to develop the machine learning model, and the RF (random forest) and ANN algorithms were used for two-step machine learning training.
801 samples of the dataset TP3T are randomly selected as the training set, and the remaining 201 samples of TP3T are used as the testing set.
During the training process, in order to determine the optimal hyper-parameters of the algorithm, the five-fold cross-validation method was used to test the models established with different hyper-parameter groups.2 Determine optimal hyperparameters.
02 From Structure to Isotherm: The SI Process
Performance Verification:In-database isotherm prediction
RF is more accurate than ANN
Based on the structural characteristics and adsorption performance data (Sa, Va, Dp, P and W) of 148 training adsorbents, the ML model was used to predict the water adsorption isotherms.As can be seen from the table below, the RF model has a high accuracy in predicting the water adsorption isotherm.

RF and ANN prediction accuracy
As can be seen from Figure a below, the water absorption of these adsorbents is distributed between 0 and 2.0 g/g, and most of them are between 0 and 0.8 g/g.
From the relative importance analysis in Figure b below, it can be seen that the adsorption pressure (P) has the greatest impact on the water absorption, and the two are positively correlated. Under a fixed pressure, the structural characteristics of the adsorbent, especially the surface area and pore volume, determine the amount of water absorption.

RF model predictions for water absorption
The RF model predicts with higher accuracy
Several typical adsorbents with different structural characteristics in the database were used as experimental objects, and the water adsorption isotherms predicted by the EWAID experimental data and the RF model were compared.
There are four main types of water adsorption isotherms in the database, type I (inverted L shape shown in Figures a and c), type V (typical S shape shown in Figures d and f), type IV and type VI (shapes with two or more adsorption steps shown in Figures g and i).
As can be seen from the figure below,Regardless of the type of isotherm and the structural properties of the adsorbed material, the predicted values of the adsorption isotherms are highly consistent with the experimental values, which verifies the high accuracy of the RF model.
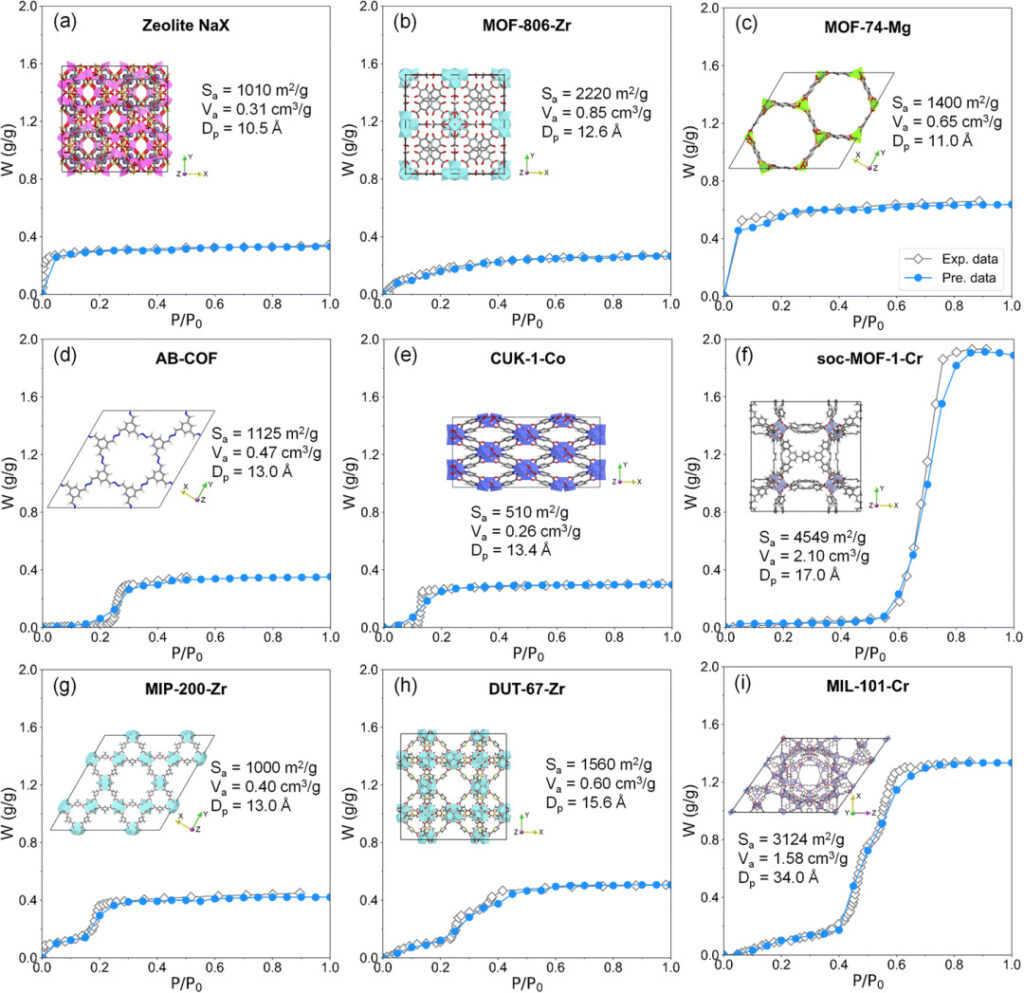
Water adsorption isotherm prediction results: gray represents EWAID experimental data, blue represents RF model prediction data
RF can identify small structural differences with higher sensitivity
The metal (MOF-74-M and CUK-1-M, M = Co, Mg, Ni) and functional group (MIL-101-Cr + X, X = NH2, SO3H, NO2) to study the changes in water adsorption isotherms caused by structural differences.
The structural parameters after modification are shown in the following table:
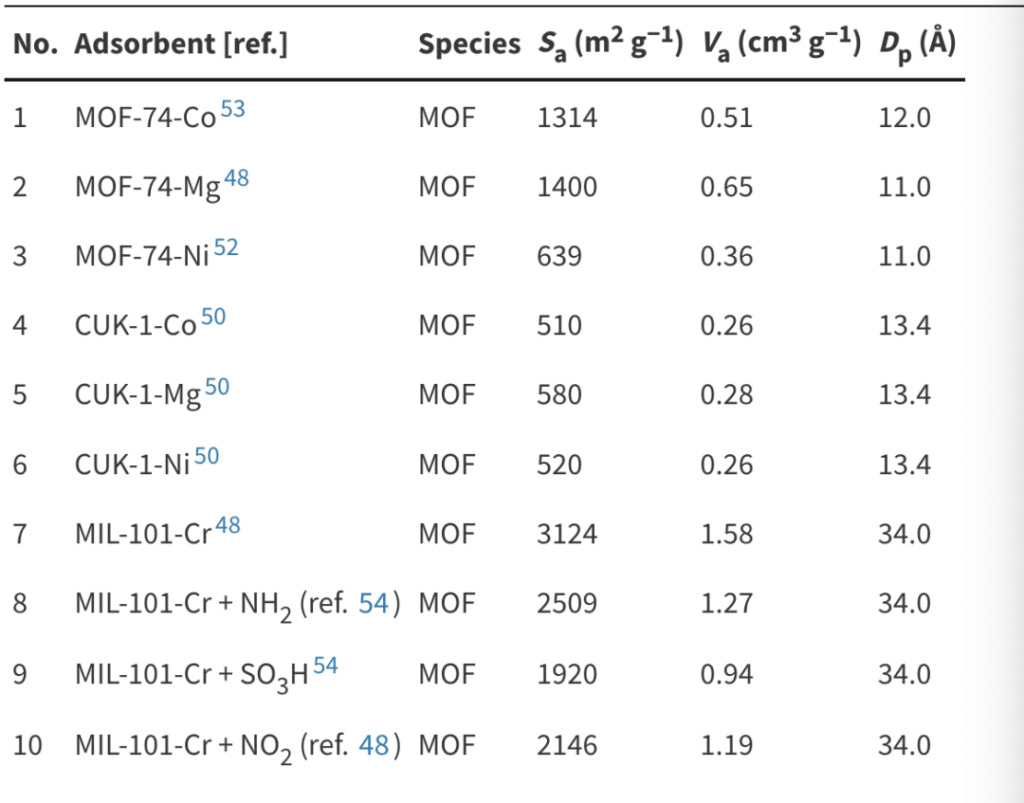
Structural characteristics of adsorbents
The corresponding water isotherm prediction results are shown in the figure below:

Water isotherm prediction results Diamonds represent EWAID experimental data, and dots represent RF prediction results
For adsorbents with slight structural differences, the RF model accurately predicted the differences in water adsorption isotherms, showing high accuracy and sensitivity.
Performance expansion:Out-of-database isotherm prediction
In order to further verify the adaptability of the RF model, the researchers selected adsorbents that are not included in the EWAID database (ZJU-210-Al, NU-405-Zr and iso-NU-1000-Zr) for testing. The results are shown in the figure below.

Water isotherm prediction results Grey represents experimental data, blue represents RF model prediction data
As shown in Figures a and b, the RF model has a good prediction for the water adsorption isotherms of ZJU-210-Al and NU-405-Zr. In Figure c, the RF model predicts the high-pressure water absorption of ISO-NU-1000-Zr lower than the experimental value.
This prediction deviation may be caused by the lack of sufficient number of high adsorption samples (water uptake > 0.8 g/g) in the EWAID database or by the inadequate structural description of ISO-NU-1000-Zr.
The results of the study on adsorbents with slight structural differences are shown below:

Water isotherm prediction results Diamonds represent EWAID experimental data, and dots represent RF prediction results
Compared with UiO-66-Zr, the additional benzene ring of the ligand of UiO-67-Zr is hydrophobic. In Figure d, the water adsorption isotherm of UiO-67-Zr shifts toward the high pressure direction.
MOF-303-Al has higher hydrophilicity than CAU-23-Al. In Figure e, MOF-303-Al shows a smaller step position, and the water adsorption isotherm moves toward the low pressure direction.
According to surface hydrophilicity UiO-66-Zr + (OH)2 > UiO-66-Zr + NH2 > UiO-66-Zr + CH3 The RF model prediction is performed in the order of2 and UiO-66-Zr + CH3 The predicted values of the isotherm step positions are greater than the experimental values and move toward the high pressure direction, indicating that the RF model overestimates their hydrophobicity.
This deviation may be caused by the fact that the descriptors of the adsorbent surface properties in the RF model are not rich enough to effectively distinguish adsorbents of the same family but with different surface hydrophilicities.
In summary, the RF model has a high prediction accuracy for the water adsorption isotherms of porous materials outside the database, and can distinguish the structural differences of materials to a certain extent. However, compared with the prediction of materials in the database, there will be some deviations. These deviations can be corrected by supplementing training data and enriching structural characteristic descriptors.
03 From Isotherms to Performance: The IP Process
Parameter extraction:COPC and SCE
Based on the water adsorption isotherms predicted by the ML model, three descriptors were extracted: saturated adsorption capacity (Wsat), the step position of the isotherm (α) and the Henry constant (KH), and analyze the performance of adsorption chillers (ACs).

Schematic diagram of adsorption isotherm characteristics
Adsorption refrigeration performance can be measured based on the coefficient of performance (COPCThe coefficient of performance for cooling and the specific cooling effects (SCE) of adsorbent/water working pairs are used to evaluate the performance.
Using the descriptor (Wsat,α,KH), ML models can quickly obtain COPC and SCE without the need for complicated calculation processes.
Performance prediction:Relationship between isotherm parameters and performance
According to the adsorption isotherm characteristics of 460 adsorbent/water working fluid pairs (Wsat,α,KH), using ML model to analyze SCE and COPC Make predictions.As can be seen from the table below, the RF model is effective in predicting SCE and COP.C All aspects have high precision.
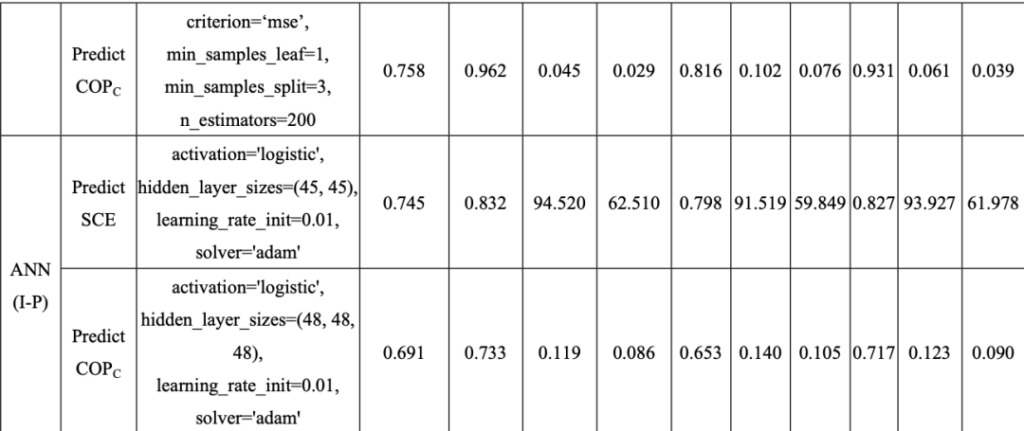
RF and ANN prediction accuracy
As can be seen from Figures a and b below, the SCE and COP of most working fluid pairs areC They are in the range of 0.400 kJ/kg and 0.4-0.8 respectively.
From the relative importance analysis of Figures c and d below, we can see that Wsat In determining SCE, KH In determining COPC The importance of 58%,This means that Wsat and SCE, KH and COPC There is a strong correlation between.

Prediction value and correlation analysis of RF for SCE and
From the figure below, we can see thatWhen the three parameters are in the range of Wsat = 0.2-0.8 g/g, α = 0.1-0.3, KH = 10-4 – 10-1 (mol/kg·Pa), the cooling performance can be maintained at (SCE > 200kJ kg-1, COPC > 0.7) and the water adsorption isotherm is V-shaped.
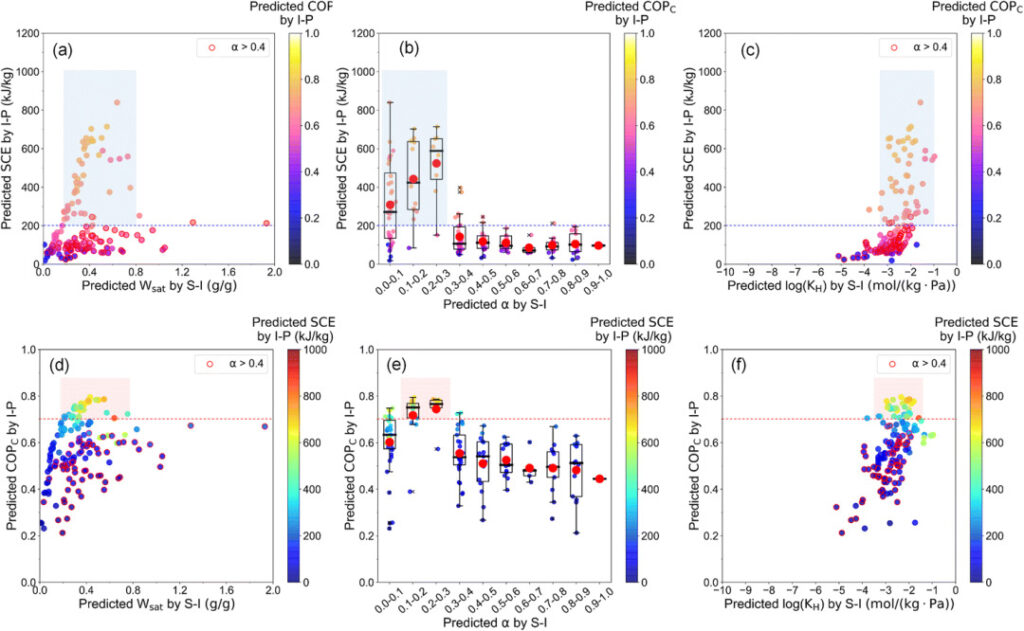
W of 148 adsorbentssat , α, KH Relationship between cooling performance
04 The new paradigm of materials research cannot be separated from machine learning
The guiding ideology of materials science can be summarized into four paradigms:
- The empirical trial and error method;
- the laws of physics and chemistry;
- Computer simulation;
- Big data driven science.
In the 1990s, Rao et al. used ANN for simulation when studying ceramic matrix composites (CMCs), which was a pioneering application of machine learning in materials science.
With the development of science and technology, the fourth paradigm combines the advantages of the other three paradigms.Machine learning is very popular in the field of materials science, and it can be found in the discovery, preparation, and performance analysis and verification of materials.
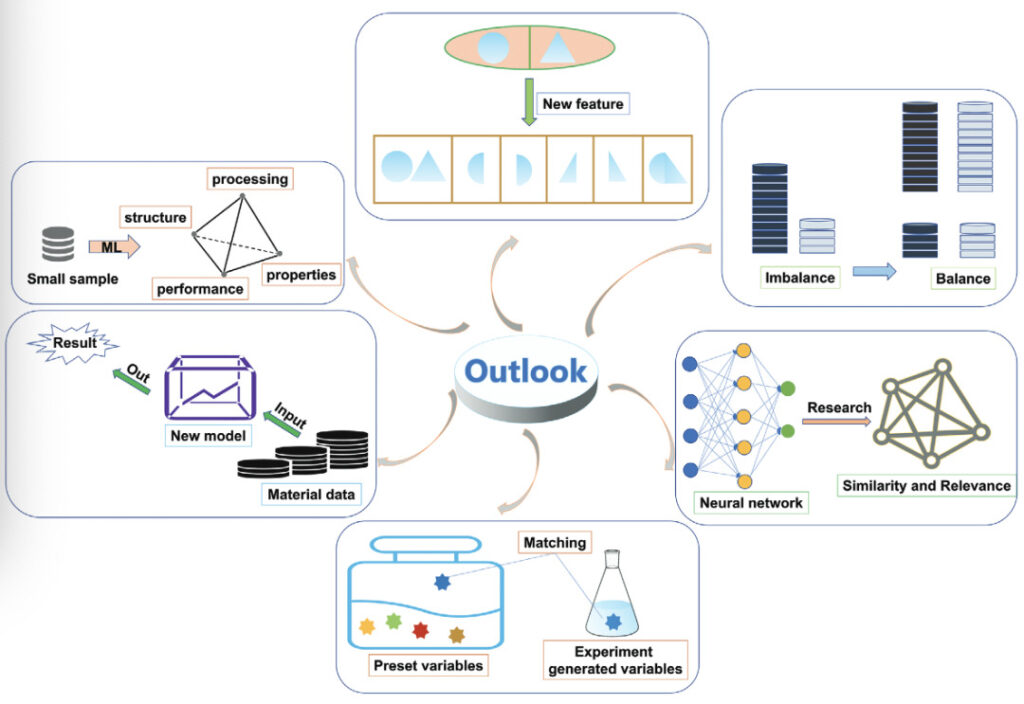
Applications of Machine Learning in Materials Science
However, researchers still have a long way to go before they can use machine learning to directly empower practical applications of materials.
Machine learning provides us with a "structure-performance" perspective. We look forward to researchers collaborating with AI to truly recognize structure, understand performance, promote innovation, and jointly explore the new future of materials science.
References:
[1]https://pubs.rsc.org/en/content/articlelanding/2023/TA/D3TA03586G
[2]https://www.sciencedirect.com/science/article/abs/pii/S235249282201741X


