Command Palette
Search for a command to run...
Kyoto University Uses CNN to Predict Food production. A Good Harvest Doesn’t Depend on the Weather, Just Ask AI.

The United Nations predicts that the world population is expected to reach 9.1 billion in 2050, and the global demand for food will increase by 70%.
However, due to the uneven development of agriculture in the world, the grain production in many regions cannot be accurately counted, so it is impossible to make reasonable plans for agricultural development in these regions. The existing grain production statistics methods are difficult to promote or require a high level of technology.
To this end, researchers from Kyoto University used convolutional neural networks (CNN) to analyze farmland photos and efficiently and accurately counted local food production, providing a new method for promoting global agricultural development.
Author | Xuecai
Editor | Sanyang
This article was first published on HyperAI WeChat public platform~
Global demand for food will increase by 70% by 2050, driven by population growth, rising incomes and widespread use of biofuels.
However, due to global warming and biodiversity decline,Food production around the world is extremely susceptible to environmental changes and development is uneven among regions.

Figure 1: Global cereal production map 2020
It can be seen that China, the United States, India and Brazil are the main grain producing areas.The food production in the southern hemisphere is relatively low, and due to the low agricultural productivity in the southern hemisphere, its food production is difficult to accurately calculate.Therefore, it is difficult for us to effectively assess local agricultural productivity, let alone provide effective means to increase production.
There are currently three commonly used methods for grain production statistics, including self-reporting, actual measurement and remote sensing statistics.The first two methods are difficult to promote on a large scale, while the use of remote sensing technology will be restricted by the local scientific and technological level.
To this end, researchers at Kyoto University used convolutional neural networks (CNNs) to analyze photos of farmland taken on the spot and then counted the local grain production. The results showed thatThe CNN model can quickly and accurately count rice yields at harvest and late maturity stages under different light conditions.This result has been published in Plant Phenomics.

Paper link:
https://spj.science.org/doi/10.34133/plantphenomics.0073
Experimental procedures
1. Create a database:Rice Canopy Photos + Grain Yield
The researchers collected photos of rice and grain yields in 20 fields in seven countries. When the rice was mature, they used a digital camera to shoot vertically downward from a height of 0.8 to 0.9 meters above the rice canopy to obtain a 1 m2 RGB photo of rice.
Note: The rice canopy is the top layer of dense rice branches and leaves, and is the main part of the plant for photosynthesis.
They then changed the shooting angle, time and period, and in some experiments removed the rice inflorescences one by one to explore the mechanism of the CNN model in predicting yield.Ultimately, they obtained 22,067 RGB photos of 462 rice varieties from 4,820 shooting locations.
The grain yield in the experiment is the coarse grain yield, including the total weight of rice grains and empty grains. The grain yield obtained by statistics is between 0.1 t/ha (tons per hectare) and 16.1 t/ha, showing a normal distribution, with an average yield of about 5.8 t/ha.

Figure 2: Rice canopy image and grain yield distribution
A: Distribution of coarse grain production in seven countries;
B: Pie chart of average coarse grain production in different countries;
C: Image of rice with the highest coarse grain yield;
D: Image of rice with the lowest coarse grain yield.
2. Production forecast:Canopy photos + CNN → Food production
The CNN model, loss function, and optimizer were deployed using the Python language and the PyTorch framework. The researchers then calculated the validation loss and relative root mean square error (rRMSE) when the model training was completed by combining different batch sizes and learning rates.The optimal Batch Size (32) and Learning Rate (0.0001) of the model were obtained.
The CNN model has 5 convolutional layers in the Main Stream (MS) and 4 convolutional layers in the Branching Stream (BS).The pooling layers of the model include average pooling layer (AveragePooling) and maximum pooling layer (MaxPooling). The activation function is mainly rectified linear unit (ReLU), and exponential linear unit (ELU) is used in some parts.Finally, MS and BS are combined and the estimated grain yield is output through the ReLU layer.

Figure 3: CNN model diagram
The CNN model has a strong ability to distinguish images.When the ground sampling spacing (GSD, the actual distance corresponding to each pixel in the photo, which is opposite to the resolution) is 0.2 cm/pixel, the correlation coefficient R between the CNN model prediction result and the actual result is2 Even if the GSD increases to 3.2 cm/pixel, the R2 It can also be maintained above 0.55.

Figure 4: Relationship between CNN model prediction results and GSD
A: The relationship between the R2 of the CNN model and the GSD of the validation set and test set photos;
B: Scatter plot of CNN model predicted output and actual output;
C & D: Schematic photos of GSD of 0.2 cm/pixel and 3.2 cm/pixel.
Furthermore, the researchers tested the CNN model using data from the prediction set. The CNN model can distinguish the difference in rice yields between Takanari and Koshihikari in Tokyo, and the predicted data is close to the actual data.

Figure 5: Actual yield (A) and predicted yield (B) of Gaocheng rice and Koshihikari rice
The team then blocked the images to explore the mechanism by which the CNN model analyzed the images and predicted grain yields. They blocked specific areas of the photos with gray blocks and calculated the difference in yield predicted by the CNN model before and after blocking.

Figure 6: Schematic diagram of occlusion experiment
A: Photo before occlusion;
B: Photo after occlusion;
C: The weight of different areas of the photo on the predicted yield.
The results showed that grain yield was positively correlated with the number of rice inflorescences, and negatively correlated with the proportion of stems, leaves, ground and other elements in the picture.
Therefore, the researchers verified the role of inflorescence in yield prediction through an inflorescence removal experiment. They picked two inflorescences from each rice plant, took photos and counted the coarse grain yield until all the inflorescences were removed.

Figure 7: Inflorescence removal experiment and results
A: Schematic diagram of the inflorescence removal experiment;
B: Photograph after inflorescence removal;
C: Line chart of expected output and actual output;
D: Relationship between expected and actual yield during inflorescence removal.
As the number of inflorescences decreased, the yield prediction results of the CNN model continued to decrease, finally falling to 1.6 t/ha.This experiment shows that the CNN model mainly judges grain yield based on the number of inflorescences in the photo.
3. Robustness:Photo angle, time and period
After verifying the CNN model’s ability to predict grain production,The researchers varied the shooting angles, times, and periods to explore the robustness of the CNN model under different conditions.
The photos were taken at angles between 20° and 90°, with a test interval of 10°.The results show that the prediction accuracy of the CNN model increases with the increase of the shooting angle.When the shooting error is 20°, the prediction results of the CNN model are -3.7-2.4 t/ha. When the shooting angle is 60°, the prediction error is between -0.45-2.44 t/ha, which is close to the prediction result at 90°.

Figure 8: Shooting angle test and results
A: Schematic diagram of shooting angle experiment;
B: Photos taken from different shooting angles;
C: The difference between the predicted yield and the actual yield from photos taken at different angles.
The camera was then placed in a fixed position to take a picture of the farmland every 30 minutes to explore the effect of shooting time on the CNN model.The results show that although the lighting environment has changed, the prediction results of the CNN model for all-day photos are basically stable.

Figure 9: Shooting time test and results
A: Schematic diagram of the shooting time experiment;
B: Photos taken at different shooting times;
C: The prediction yield of the CNN model for photos taken at different times.
Finally, the researchers explored the impact of the shooting period on the prediction results of the CNN model.After the heading of rice 50%, they went to the fields every week to collect photos and analyzed them with the CNN model. In the early stage of rice maturity, the predicted yield of the CNN model was lower than the actual yield at the harvest time because the inflorescence was not fully mature at this time.
Over time, the CNN model's predictions gradually get closer to the actual production. Four weeks after heading, the prediction results of the CNN model were basically stable and close to the actual yield of 50%.

Figure 10: Tests and results during filming
A: Photos taken at different times, DAH stands for days after heading, DBH stands for days before harvest;
B: Prediction results of the CNN model for photos taken at different times.
The above results collectively show that the CNN model can accurately analyze farmland photos taken at different shooting angles, times, and periods, and obtain stable yield prediction results. The CNN model is robust.
Smart Agriculture: AI helps agricultural planning
According to the United Nations, the world's population will reach about 9.1 billion in 2050. As the global population grows and incomes rise, the demand for food is also increasing.
At the same time, the intensification, digitalization and intelligence of agricultural production have continuously increased grain yield per mu. From 2000 to 2019, the global agricultural land area decreased by 3%, while the output of major crops increased by 52%, and the output of fruits and vegetables also increased by about 20%.
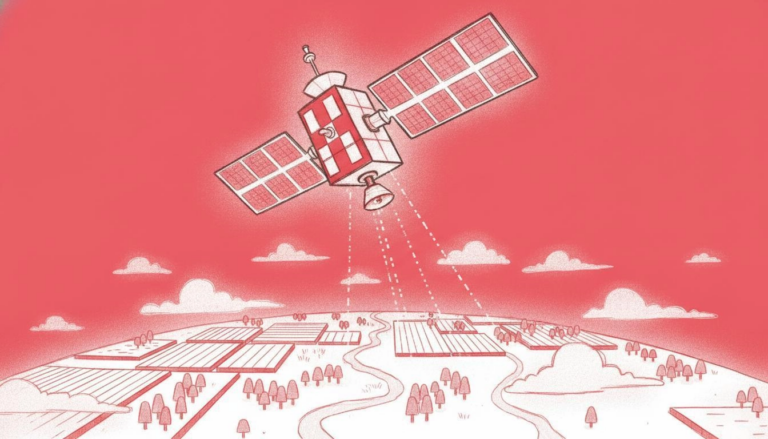
The use of professional equipment such as large harvesters and drones allows farmers to plan their farmland accurately and conveniently. Technologies such as big data and the Internet of Things help farmers perceive the conditions of farmland in real time and automatically adjust the environment in the greenhouse. Deep learning and big models can predict the weather in advance to prevent extreme weather and alleviate the problem of traditional agriculture "relying on the weather for food".

Figure 11: Schematic diagram of smart agriculture system
However, as of 2021, the number of people affected by hunger worldwide has increased by approximately 46 million from the previous year to 828 million.The problems of unbalanced agricultural production and an imperfect system still exist and are even more prominent.
With the help of AI, we can make better plans for local agricultural development.Promote the balanced development of world agricultural production and provide a satisfactory answer to solving the global hunger problem.
Reference Links:
[1] https://www.fao.org/documents/card/en/c/cc2211en
[2] https://www.deccanherald.com/opinion/smart-farming-tech-new-age-700994.html
This article was first published on HyperAI WeChat public platform~