Command Palette
Search for a command to run...
Fill in the Blanks in the Material Space: MIT Uses Deep Learning to Solve Nondestructive Testing Problems
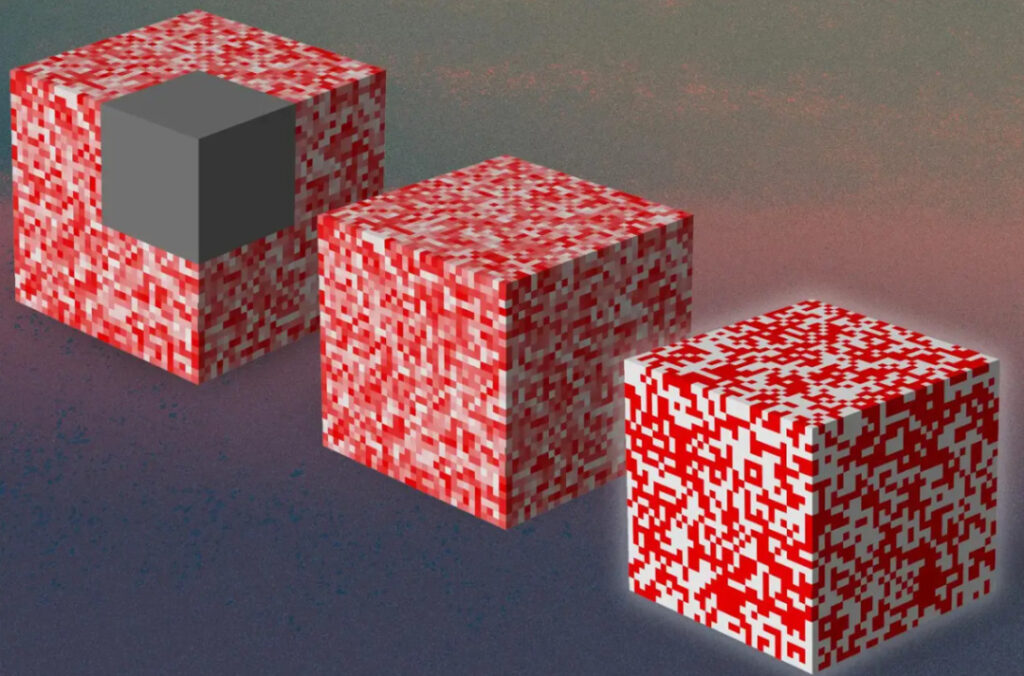
Contents at a glance:Material testing plays a vital role in engineering, science, and manufacturing. Traditional material testing methods, such as cutting and chemical reagent testing, are destructive, time-consuming, and resource-intensive. Recently, MIT scientists have developed a technique using deep learning that can fill in the missing information and further determine the internal structure of the material through surface observation.
Keywords:Deep Learning Material Testing CNN
Author: daserney
Editor|Sanyang
This article was first published on HyperAI WeChat public platform~
When processing data, one often encounters the challenge of restoring a complete image from blurred images or partial information.This challenge is called the "inverse problem," and it is not only common in medical diagnostics, but also frequently occurs in materials science.If we can effectively fill in this missing information, it will be possible to understand the properties of biological tissues or materials more comprehensively and accurately, thereby making more precise decisions.
How to non-destructively test the internal structure of materials has troubled many relevant practitioners. Non-destructive testing refers to the use of modern technology and equipment to detect the internal structure of materials without damaging or affecting the internal organization and performance of the materials.While detection can be done using techniques such as X-rays, these methods are generally expensive and require bulky equipment.
To this end, MIT (Massachusetts Institute of Technology) Chinese doctoral student Zhenze Yang and Professor Markus Buehler combined multiple deep learning architectures.In the 2D and 3D cases, respectively, the missing parts in the material are recovered with limited information and the microstructure is further characterized.
Currently, the research results have been published in the journal Advanced Materials, titled "Fill in the Blank: Transferrable Deep Learning Approaches to Recover Missing Physical Field Information".

The studyThe results have been published in Advanced Materials
Paper address:
https://onlinelibrary.wiley.com/doi/full/10.1002/adma.202301449
Experimental Overview: Model Combination for "Fill in the Blanks Puzzle"
The figure below shows the overall schematic diagram of the study.In the left image, the gray cube is the missing part. In the 2D and 3D cases, two AI models were combined to perform the task. The researchers trained the first AI model to "fill in the gaps" and recover the complete field from the masked field, and trained the second AI model to "solve the puzzle" and use the recovered complete field as input to reversely obtain the corresponding microstructure of the composite material.
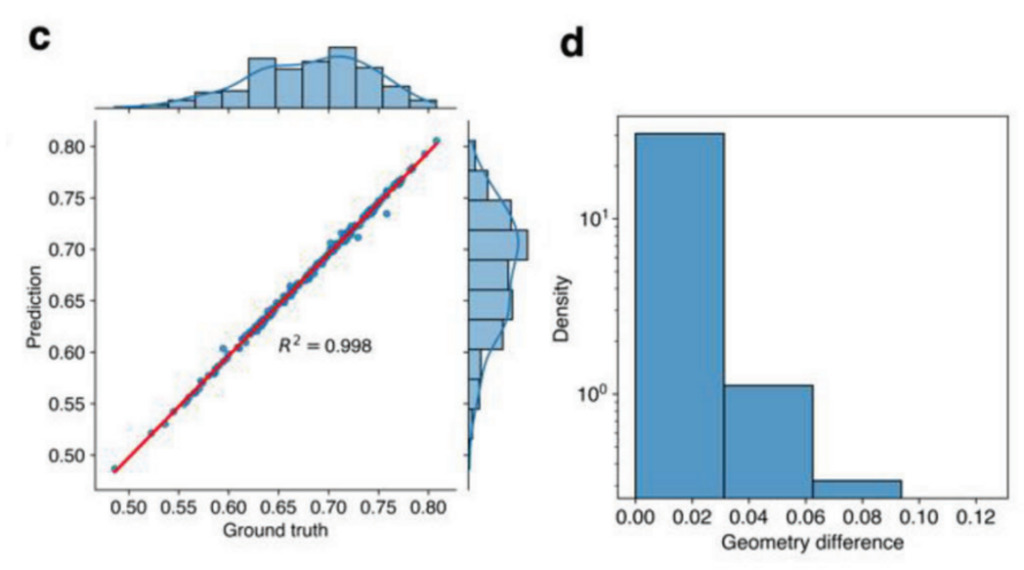
Figure 1: Overall schematic diagram
The researchers used finite element analysis (FEA) to calculate the strain and stress fields of 2D and 3D composite materials under specific conditions.
In the 2D case,The researchers created a symmetrical 8×8 grid to construct the composite geometry (a total of 232 possible geometries).1,000 different composite microstructures were randomly generated for uniaxial tensile testing.
In the 3D case,The researchers used a 2×4×4 grid to create two layers of microstructures (a total of 232 possible geometries), and a 4×4×4 grid to build a 4-layer composite (a total of 264 possible geometries). In order to keep the number of possible geometries the same as in the 2D case, the researchers chose a 2×4×4 grid as the baseline.And 2,000 different geometries were randomly generated for FEA calculations.
Data visualization and preprocessing
In the 2D case,Using Abaqus visualization tools, the researchers generated images of the strain and stress fields obtained from FEA.It is represented by white and red bars.Then, it is preprocessed by Python for cropping, resizing and recoloring. The size of the preprocessed image is 256 × 256. In the composite geometry or microstructure, the red blocks represent soft materials, while the white blocks represent rigid materials.The researchers introduced regular and irregular shaped masks, where regular masks were square in shape and ranged in size from 96-128.
In the 3D case, the researchers collected strain and stress values for each element.It is then normalized to form a 16×32×32×1 matrix.Similar to the 2D case,Use Python code to visualize the contours of strain and stress fields.A series of field images are stored in a 16×32×32×3 matrix, which is used as the data representation for training and testing deep learning models.The corresponding 3D composite microstructure visualization was performed by volume rendering using the Matplotlib library.
Model selection: GAN + ViViT + CNN
This study used a variety of deep learning models.Including Generative Adversarial Networks (GAN), Transformer-based ViViT models, and Convolutional Neural Networks (CNN).
- GAN: To fill in the 2D images, the researchers used a GAN model, known as the second version of the DeepFill model, which can perform free-form image restoration.
- ViViT: In the 3D case, the researchers used the ViViT model based on the Transformer architecture to fill in the gaps.
- CNN: After obtaining the complete field, CNN models were used in both 2D and 3D cases to establish a reverse link from the mechanical behavior to the microstructure of the composite material.
Experimental results: ViViT + CNN achieves perfect prediction
2D Case
To obtain the prediction error, the researchers plotted the predicted stress mean against the actual value within the masked region, whose shape was randomly generated.As shown in Figure c below, given 200 test data R2 The index reaches 0.998, indicating that the GAN model performs well.
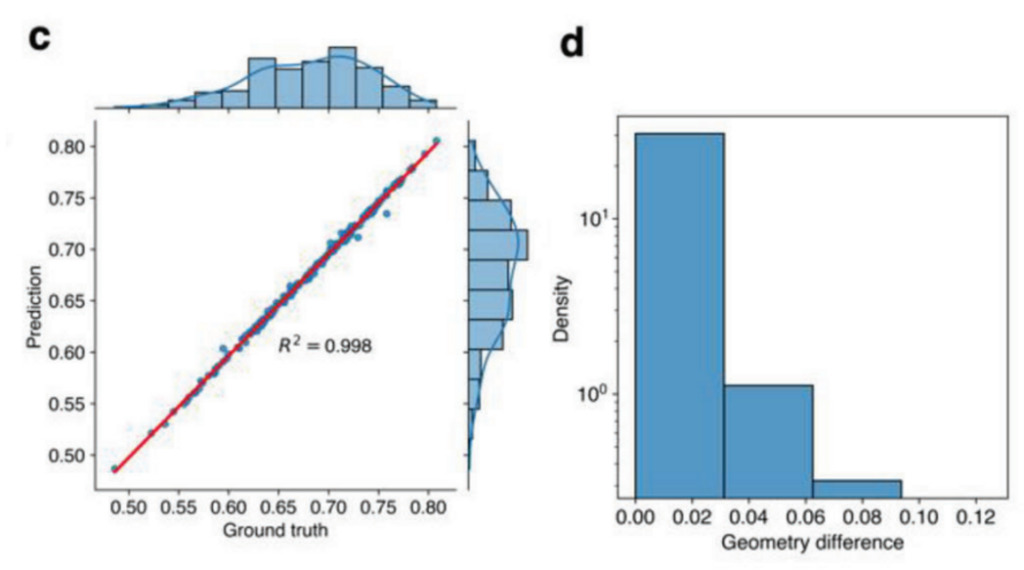
Figure 2: Model performance in 2D
c: Performance of the GAN model on the filled image. The ground truth and the predicted value show a high consistency (R2 = 0.998).
d: Performance of CNN model for geometry recognition. The figure shows the distribution of geometry difference between ground truth and prediction results.
In addition, the researchers evaluated the performance of the CNN model in geometry recognition by calculating the geometry difference, which is the number of different material blocks between the true sequence and the predicted sequence.As shown in Figure 2d, most of the predicted sequences are the same as the actual sequences. The maximum geometry difference among all 200 test data is 0.0625, and there are two differences among the 32 blocks.If the restored field image is inaccurate, the geometric error will increase. Therefore, the accurate prediction of the CNN model further verifies the high performance of the GAN model.
3D Situation
In actual engineering practice, the microstructure of 3D composite materials is usually more complex than that of 2D ones. The following figure shows the comparison between 8 predicted field frames and ground truth. The results show thatThe improved ViViT model is able to use the mechanical fields of one layer (frames 1 to 8) in the composite to accurately predict the fields of another layer (frames 9 to 16).
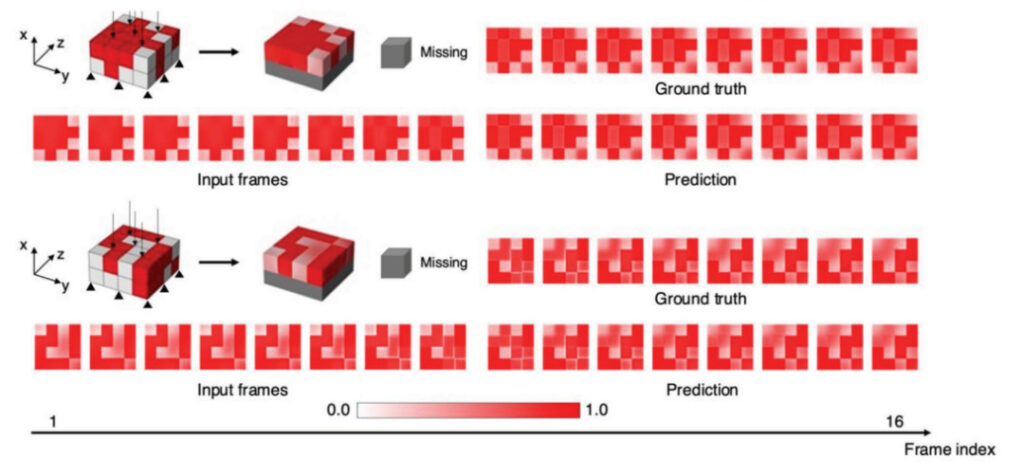
Figure 3: Field frame predictions for two examples of two-layer composite materials.
The first 8 frames are taken as input and the remaining 8 frames are predicted by the deep learning model.
Figure 4 shows the mean square error (MSE) of frames 9 to 16 for all 200 test data. The MSE for each data point is calculated by averaging the squared differences in pixel values between the predicted field maps and the true values. The overall MSE of the 8 predicted frames is very low, and the average MSE of all frames is less than 0.001, showing the excellent performance of the ViViT model.
Mean Squared Error (MSE) is a commonly used indicator to evaluate the accuracy of a prediction model. In the prediction process, MSE is used to measure the difference between the predicted value and the true value. The smaller the MSE value, the higher the accuracy of the prediction model.
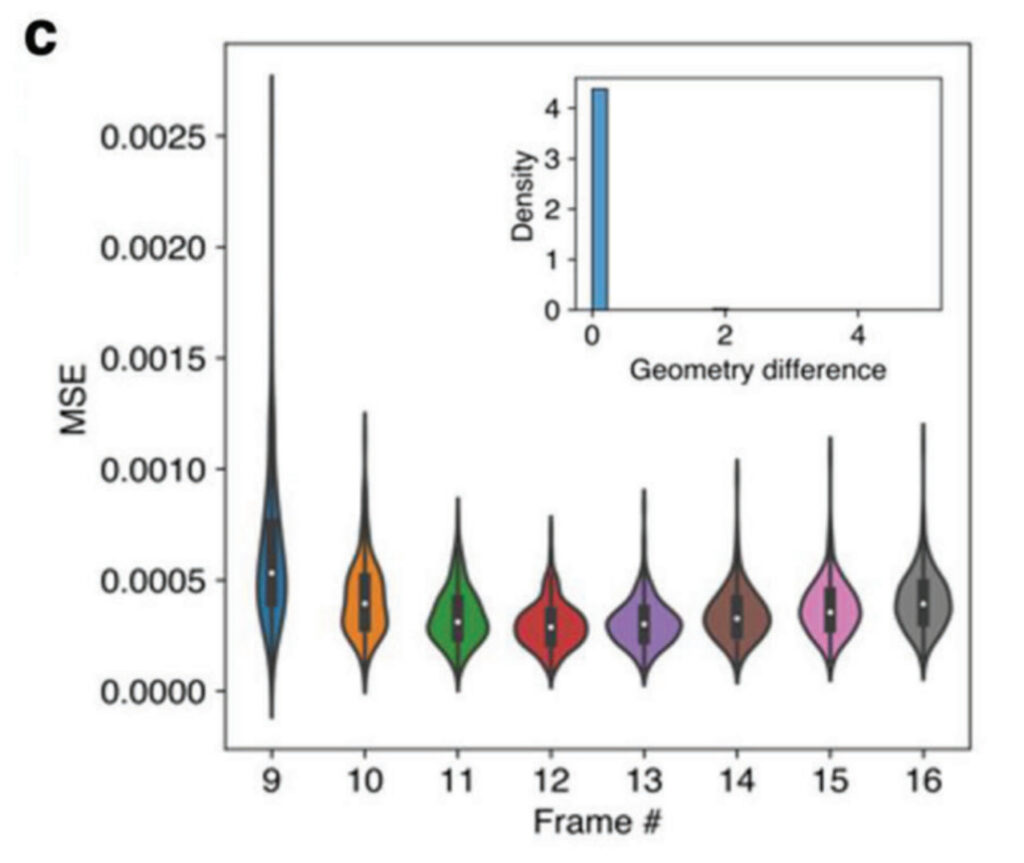
Figure 4: Error distribution
Through the predicted field frame, the complete 3D mechanical fields can be used to determine the microstructure of the composite material. Similar to the 2D case, the researchers used a CNN model to make predictions. As shown in the upper right sub-image of Figure 4,The geometry difference is 0. By combining the improved ViViT model with the CNN model, accurate identification of the internal 3D microstructures can be achieved, with most of the geometric shapes perfectly predicted.
LAMM Lab: Linking Material Structure and Function
The research was jointly completed by MIT's Chinese doctoral student Zhenze Yang and Professor Markus Buehler.Zhenze Yang is a PhD student at MIT, working in the MIT Laboratory of Atomic and Molecular Mechanics (LAMM). His research interests include combining machine learning and deep learning techniques with multiscale simulation methods to accelerate the performance calculation and design of various materials such as composites, nanomaterials, and biomaterials.Prior to this, Yang Zhenze received a bachelor's degree in physics from the University of Chinese Academy of Sciences.

Yang Zhenze and Professor Markus Buehler
Yang Zhenze's personal website:
Laboratory Address:
http://lamm.mit.edu/
The corresponding author, Markus Buehler, is a principal investigator at LAMM. Markus Buehler is a highly cited academic researcher with more than 450 publications in computational materials science, biomaterials and nanotechnology.One of his goals is to use music and sound design, combined with artificial intelligence, to simulate, optimize and create new forms of autonomous matter from the ground up in an abstract way, across scales (e.g., from nano to macro) and species (e.g., from humans to spiders).
LAMM is dedicated to developing a new paradigm to design materials starting from the molecular scale. Combining concepts from structural engineering, materials science and biology, LAMM connects basic atomic-scale chemical structure to the functional scale, by understanding how biomaterials form hierarchical structures to achieve superior mechanical properties.Blending the concepts of structure and function.
Reference Links:
[1]https://zhuanlan.zhihu.com/p/632154023
[2]https://scitechdaily.com/mits-ai-system-reveals-internal-structure-of-materials-from-surface-observations/?expand_article=1
[3]https://professional.mit.edu/programs/faculty-profiles/markus-j-buehler
This article was first published on HyperAI WeChat public platform~

