Command Palette
Search for a command to run...
Feature Selection Strategy: Finding New Ways to Detect Breast Cancer Biomarkers

Contents at a glance:MicroRNA (microribonucleic acid) is a class of short, single-stranded non-coding RNA transcripts. These molecules show uncontrolled growth in a variety of malignant tumors, and therefore have been identified by many studies in recent years as reliable biomarkers for diagnosing cancer. In various pathological analyses, differential expression analysis is often regarded as an effective method for detecting key biomarkers, while researchers from the University of Naples Federico II in Italy proposed that a feature selection strategy based on machine learning can be more effective for detection, and recommended that the 20 microRNAs they discovered be used as diagnostic biomarkers for breast cancer.
Keywords:Feature selection microRNA Breast cancer
This article was first published on HyperAI WeChat public platform~
According to the 2022 edition of the "Breast Cancer Treatment Guidelines" issued by the National Health Commission,Breast cancer is one of the common malignant tumors in women, and its incidence rate ranks first among malignant tumors in women.According to statistics from the World Health Organization, in 2020, a total of 2.3 million women worldwide were diagnosed with breast cancer. With the continuous improvement of treatment methods,The five-year survival rate of early breast cancer can reach 90% or even higher. Therefore, accurate diagnosis of early breast cancer is particularly important.
In addition to its many key biological functions, changes in microRNA expression are also associated with a variety of cancers, so it can be used as a reliable diagnostic biomarker. Researchers from the University of Naples Federico II in Italy used machine learning toBy using feature selection strategy and analyzing the stability and classification performance of three methods,A panel of breast cancer-specific diagnostic biomarkers was obtained, and putative key genes in the development and progression of breast cancer disease were discovered.
Currently, this research result has been published in the Proceedings of the 18th Conference on Computational Intelligence Methods in Bioinformatics and Biostatistics (CIBB 2023) with the title "Robust Feature Selection strategy detects a panel of microRNAs as putative diagnostic biomarkers in Breast Cancer".
The research results have been published in CIBB 2023
Paper address:
https://www.researchgate.net/publication/372083934
Experiment Overview
In this study, researchers found that with the help of three feature selection methods (gain rate, random forest and support vector machine recursive feature elimination), diagnostic molecular combinations can be extracted more efficiently. They revealed a panel of 20 microRNAs, among which hsa-mir-337, hsa-mir-378c and hsa-mir-483 have not received widespread attention in the medical community among the current breast cancer diagnostic biomarkers. This method can distinguish between healthy and tumor samples, and compared with the commonly used differential expression method, its classification performance is better and it is easier to identify features that are easily underestimated or even ignored.
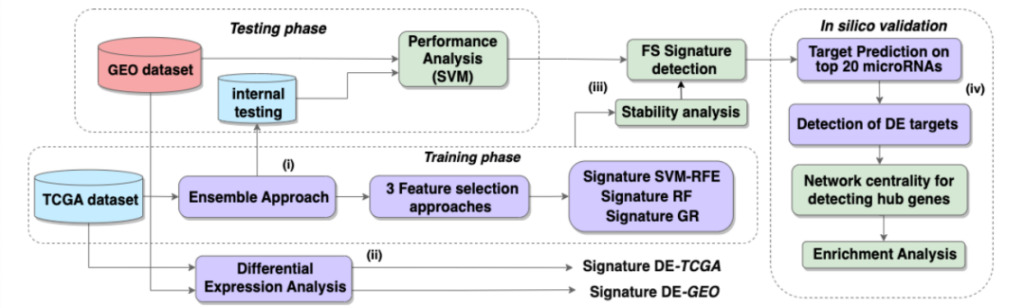
Figure 1: Pipeline Overview
The workflow consists of 4 key steps:
(i) Ensemble-FS calculations on the training TCGA subset
(ii) Differential expression analysis of TCGA/GEO datasets
(iii) Compare the classification performance of differential expression analysis and feature selection results, and evaluate the stability of feature selection methods
(iv) Computer simulation was used to verify the top 20 microRNAs of the selected signature and to detect hub gene targets.
Experiment details
Dataset
The experimental data sources include two channels:The TCGA-BRCA project on the official website of the US GDC and the Gene Expression Omnibus (GEO) data repository (GSE97811).
The experimental team collected a total of 1,881 microRNA-Seq data from the GDC TCGA-BRCA project and divided them into two parts, training set and test set, in a ratio of 8:2. These data are related to 300 solid primary tumor samples (T) and 101 normal adjacent tumor (NAT) samples, all of which belong to ductal and lobular breast tissue. Before applying the feature selection method,These data have been subjected to variance stabilizing normalization.
At the same time, researchers downloaded a microarray dataset containing 2,565 microRNAs from the GEO database (GSE97811).It is used as the validation set for this experiment.The dataset includes 16 normal samples and 45 tumor samples, and then data imputation is performed.
Since the GEO data (the validation set in this experiment) involves the expression of mature microRNAs, and the TCGA data (the training set and test set in this experiment) contain the precursor form, in order to unify the data, the researchers only selected alternative mature microRNAs with average count values higher than their opposite strands in the GEO data samples; at the same time, the names of the microRNAs have been converted to the corresponding precursor form names.
After this process,The dimensionality of the GEO data (validation set) was reduced to 1,361 microRNAs, and the corresponding TCGA RNA-Seq data were also collected, including a total of 20,404 genes.
1. Feature selection method and Ensemble program application
The researchers selected three feature selection methods for comparison with differential expression analysis.They are Gain Ratio, Random Forest, and SVM-RFE (Support Vector Machine Recursive Feature Elimination).The three methods were applied to 500 subsets of microRNA-Seq expression TCGA data to identify a robust feature panel that can distinguish normal samples from tumor samples. In the observed results, the training set and the test set were divided into a ratio of 8:2, and then the data was bootstrapped by resampling to make it conform to the Data Perturbation Ensemble procedure. Each calculation returns 500 microRNA vectors sorted in descending order of "importance score".
|Remarks:The importance score represents the influence of each feature in the classification calculated by the algorithm.
The higher the importance score, the lower the rank assigned to the feature.The researchers then used an aggregation procedure to derive a consensus signature for each feature selection method, and ultimately retained the top 200 features for each group of microRNAs.
2. Stability test
The Kuncheva Index (KI) and Percentage of Overlapping Gene/Features (POG) were used to assess the consistency of feature selection methods, and the Stot statistic (pairwise measure of KI) was used to determine the stability among all methods.These statistics are calculated as the signature length increases.The number of features starts from 2 and ends at 200, and each recalculation increases by 2 units.

Stot statistics formula
3. Differential expression analysis and DE-signature
Differential expression analysis was performed on TCGA datasets (including microRNA-Seq and RNA-Seq), starting from the raw counts, using the Exact Test, and then retaining DE features with FDR <= 0.01 and Log2FC threshold of |0.5|.To obtain the signature of DE-microRNA, the Log2FC values were converted into absolute values, and the microRNAs (the first 200 features were retained) were sorted in the descending order of abs (Log2FC).
The GEO validation set was differentially expressed using Limma, and the parameters and procedures for obtaining DE-signatures in this dataset were consistent with those of the TCGA dataset.
4. Classification Performance Analysis
To determine the ability of each signature to distinguish healthy people from cancer patients,The researchers conducted predictive analysis on four signatures (including feature selection panels and differential expression panels) on both the test subset (TCGA) and validation set (GEO).
Finally, the average accuracy (ACC), K statistic (KK) and Matthews correlation coefficient (MCC) are calculated for each fold and multiple lengths of each signature.
5.SVM-RFE microRNA-signature target detection
To identify potential gene targets of microRNA,The researchers performed the following operations:
1. The top 20 SVM-RFE microRNAs were classified according to whether they were up-regulated or down-regulated in tumor samples.
2. Differential expression analysis was performed on RNA-Seq data to detect differentially expressed genes (FDR <= 0.05).
3. Spearman correlation analysis was applied to compare microRNA expression with differentially expressed genes, and only up-genes that were negatively correlated with down-microRNAs and down-genes that were negatively correlated with up-microRNAs were retained (rho <= -0.5).
4. All validated microRNA gene targets were collected and only those that also showed DE-correlated were retained.
6. Network centrality and hub gene identification
Correlation matrix (Spearman) of selected dysregulated genes,And use it to build a graph-structured gene network:Hub genes with Kleinberg's hub centrality score > 75, rho > 0.8 or rho < -0.6 were retained. Gene enrichment analysis (ORA) was performed on the hub genes to explore the most enriched pathways from the REACTOME database. The FDR-adjusted pValue threshold was set to 0.005.
Experimental Results
The experiment showed that after applying the three feature selection methods, 500 microRNA signatures were returned in descending order of importance score, and three consensus panels were obtained after summarization. It is worth noting that the top three microRNAs (hsa-mir-139, hsa-mir-96 and hsa-mir-145) appeared in all panels, showing the importance of these molecules in distinguishing tumor samples from healthy samples.
Conclusion 1: SVM-RFE has the highest stability
From the calculation of KI and POG on the consensus panel,The SVM-RFE method is the most stable, and it is most prominent when the signature length reaches 20 features. Similarly, the results of the Stot index also show that the SVE-RFE method has the highest stability.
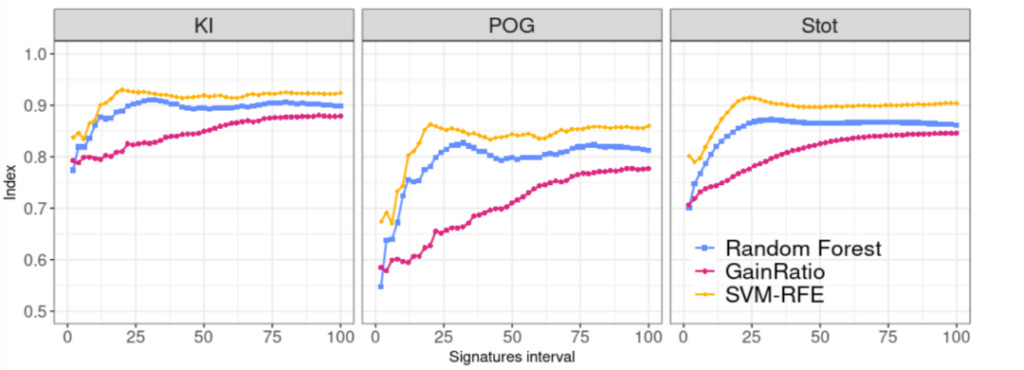
Figure 2: Comparison of stability index of three feature selection methods
blue:Random Forest
pink:Gain Ratio
yellow:SVM-RFE (Support Vector Machine Recursive Feature Elimination)
|Conclusion 2: SVM-RFE signature performs better than differential expression signature in classification
After the classification performance analysis of all individual panels, both the test set (TCGA) and the validation set (GEO) showed that the signature obtained by SVM-RFE had the highest predictive ability.
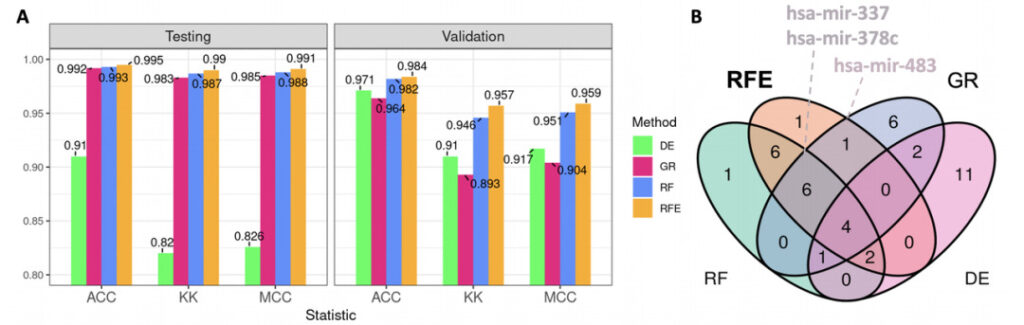
Figure 3: Classification performance of the top 20 microRNAs and Venn diagram
A:The bar chart shows the average statistic calculated on the test subset and the external validation GEO dataset.
ACC:Accuracy
KK:K statistic
MCC:Matthews correlation coefficient
green:DE (differential expression analysis, the control method in this experiment)
pink:GR (Gain Ratio)
blue:RF (Random Forest)
orange color:RFE (SVM-RFE, Support Vector Machine Recursive Feature Elimination)
B:Venn diagram of the top 20 microRNAs for each signature, with some interesting microRNAs from the top 20 of the SVM-RFE panel labeled – hsa-mir-337, hsa-mir-378c, and hsa-mir-483. These three micro-RNAs appeared in all three feature selection methods, but their reliability as diagnostic evidence has not yet been fully determined in current studies on breast cancer.
|Conclusion 3: Network analysis reveals potential key genes in disease evolution
Experiments have shown that CDC25, TPX2 and KIF18B are highly expressed in stem cells of different types of cancer and triple-negative breast cancer patients, and downregulation of TGFBR2 is associated with cancer progression.
MicroRNA: Another ideal candidate for early screening of breast cancer
Traditional breast cancer screening methods are still based on X-ray imaging and tissue biopsy, which cannot establish a deeper and more comprehensive understanding of the complete cancer genome. This method is not only highly invasive, costly, and prone to side effects, but also often gives false positive or false negative results. Improving the accuracy of early screening for breast cancer and patient experience,There is still a need to develop new strategies to address the burden of breast cancer.
Since its first discovery in 1993, micorRNA has continued to deepen our understanding of cancer and has shown great potential as a reliable biomarker for breast cancer diagnosis.
MicroRNA is a small non-coding RNA with a length of about 19-25 nt, which can regulate a variety of target genes.Involved in the regulation of a variety of biological and pathological processes.Including the formation and development of cancer, it is expected to make up for the limitations of current X-ray imaging and tissue biopsy as the mainstream diagnostic methods for breast cancer screening in clinical practice.
However, mature clinical applications of microRNA have not yet been fully developed, and a safety assessment system for the use of microRNA has not yet been established.It will probably take some time for microRNA to become the mainstream diagnostic basis for cancer.
Reference articles:
[1]https://www.who.int/zh/news-room/fact-sheets/detail/breast-cancer
[2]https://guide.medlive.cn/guideline/25596
[3]https://www.abcam.cn/kits/micrornas-as-biomarkers-in-cancer-1
[4]https://caivd-org.cn/webfile/file/20220508/20220508153691029102.pdf
[5]https://www.sohu.com/a/318088245_100120288
This article was first published on HyperAI WeChat public platform~