Command Palette
Search for a command to run...
TorchServe Explained: 5 Steps to Deploy Models to Production Environment

Contents:
TorchServe has been launched in April 2020 and has gone through more than two years of development. It has become more mature and stable. This article will give a comprehensive introduction to TorchServe.
This article was first published on WeChat official account:PyTorch Developer Community
For more practical model deployment practices using PyTorch, visit openbayes.com Get
TorchServe is the preferred solution for deploying models to production environments in PyTorch.It is a well-behaved and extensible tool that encapsulates models with an HTTP or HTTPS API.
The front end of TorchServe is implemented in Java and can handle a variety of tasks, including allocating workers for deploying models, communicating between clients and servers, etc. Its Python back end is mainly responsible for handling the inference service.

Figure 1: Overview of TorchServe performance tuning process
In addition, it also supports AB testing, dynamic batching, logging, and various model serving and versioning of metrics.The 4 public APIs include:
* Inference API:Listens on port 8080, accessible via localhost by default, can be configured in the TorchServe configuration, and supports getting predictions from the model.
* Explanation API:Use Captum under the hood to provide a description of the model being deployed and listen on port 8080.
* Management API:Allows to register or unregister and describe models. It also allows the user to increase or decrease the number of workers to which the model is deployed.
* Metrics API:By default it listens on port 8082, allowing users to monitor the model being deployed.
TorchServe supports batch inference and deploys models to multiple workers.Allows users to scale model deployment and handle peak traffic. This scaling can be done through the Management API and settings in the configuration file. In addition, the Metrics API can monitor model deployment through default and custom metrics.
Other advanced settings, such as the length of the queue for receiving requests, the maximum waiting time for a batch of inputs, and other properties,Both can be configured via a config file (which can be passed to TorchServe when starting up).
The steps to deploy a model with TorchServe include:
1. Install TorchServe, model archiver and other dependencies
2. Select a suitable default handler (such as image classification) or create a custom handler
3. Use Torcharchive to package model artifacts and handlers into one .mar file and put it into the model store
4. Start deploying the model
5. Run inference
TorchServe project address:
TorchServe Key Concepts: Handler
The TorchServe backend uses a handler to load the model, preprocess the received data, run inference, and post-process the response. The handler in TorchServe is a PPython script, all model initialization, preprocessing, inference, and post process logic are included in it.
TorchServe also provides an out-of-the-box handler for applications such as image classification, segmentation, object detection, and text classification. In addition, it also supports custom handlers in case the default handler does not support the current case.
Custom handlers provide great flexibility.This could make TorchServe a multi-framework serving tool.Custom handlers allow you to initialize a model with custom logic, and also allow the model to load models from other frameworks (such as ONNX).
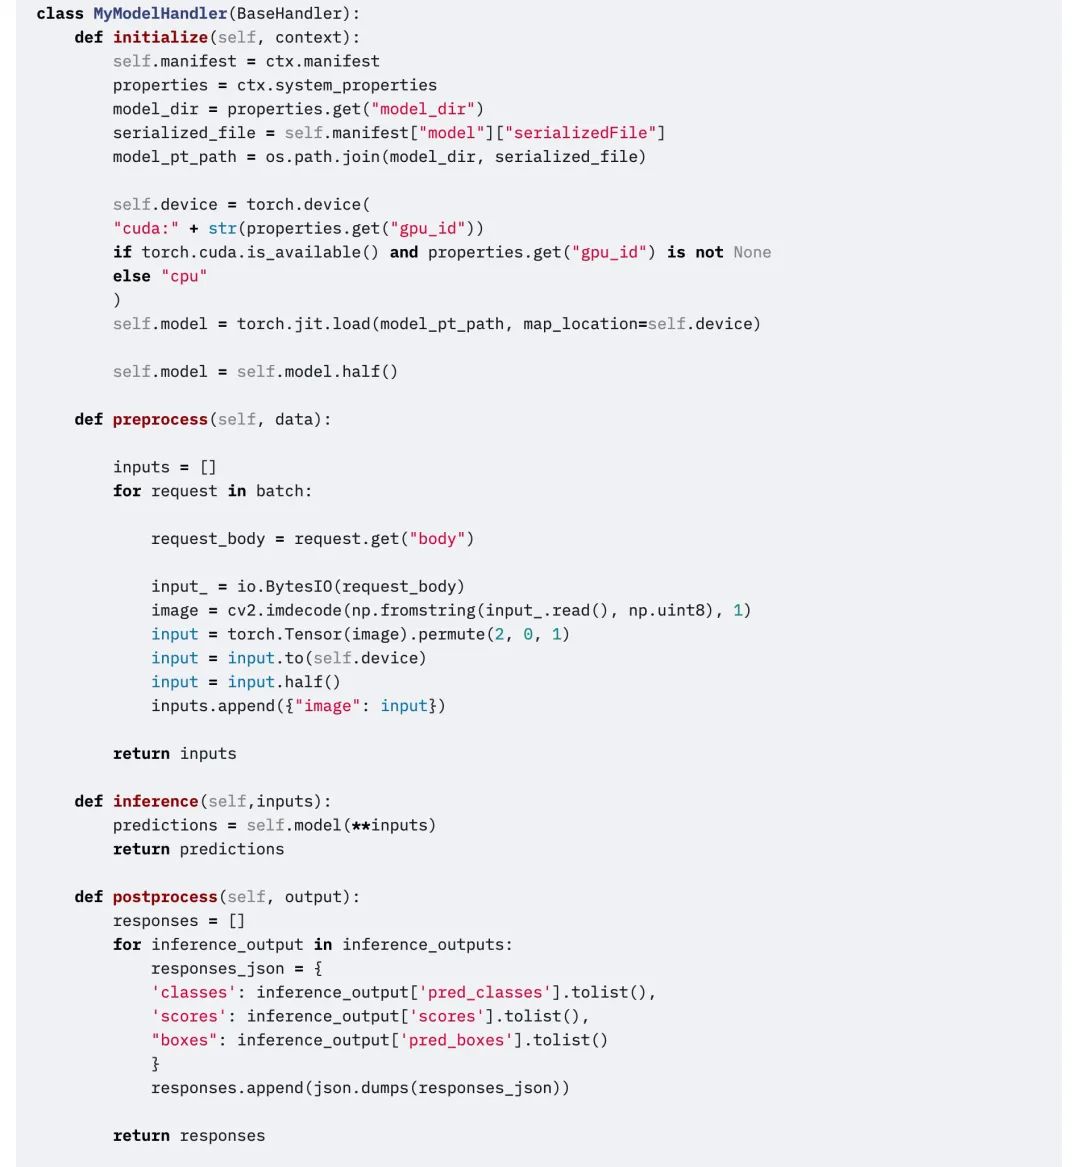
The TorchServe handler consists of four main functions,functions , initialize , inference and preprocess, each function returns a list.
The following code snippet is an example of a custom handler. The custom handler inherits the BaseHandler in TorchServe.Can override any main function.This example demonstrates how to use the handler to load the Detectron2 model to solve the figure detection problem. The model has been exported to Torchscript and used mod.half() Run FP16 inference.
edit
TorchServe Key Concepts: Metrics
When deploying a model to a production environment, it is important to monitor its performance. TorchServe collects system-level metrics regularly and allows you to add custom metrics.
System-level metrics include CPU utilization, available and used disk space and memory on the host, and the number of requests with different response codes.(For example, 200-300, 400-500, and above 500). Custom metrics can be added to the Custom Metrics API.
Custom Metrics API:
TorchServe records these two sets of metrics to different log files. By default, metrics are collected in:
System metrics: log_directory/ts_metrics.log
Custom metrics:log directory/model_metrics.log
TorchServe's Metrics API listens on port 8082 by default and allows users to query and monitor collected metrics. The default metrics endpoint returns Prometheus formatted metrics. You can query metrics with curl requests, or point Prometheus Server to the endpoint and use Grafana for the Dashboard.
Use curl to query metrics:
curl http://127.0.0.1:8082/metricsExample of exporting logged metrics to Prometheus using mtail:https://github.com/google/mtail
By tracking these metrics in the Dashboard, you can monitor performance regressions that may occur sporadically or be hard to spot during offline benchmark runs.
What's Next
The above is all about TorchServe. In the next section, we will use a specific case toExplain the specific factors that affect the deployment of models to production environments, and how to use TorchServe to tune the Animated Drawings APP.
For more learning materials and practical tutorials, please follow the official account:PyTorch Developer CommunityTo watch the tutorial in action, visit openbayes.com Practical operation.