Command Palette
Search for a command to run...
ChartQA: A Benchmark Dataset for Answering Questions About Charts Using Visual and Logical Reasoning
Date
Size
Publish URL
Paper URL
Tags
Dataset background
Graphs are very popular in data analysis. When exploring graphs, people often ask various complex reasoning questions involving multiple logical and arithmetic operations. They often also mention the visual features of the graphs in their questions. However, most existing datasets do not focus on such complex reasoning questions because their questions are template-based and the answers come from a fixed vocabulary.
Dataset Introduction
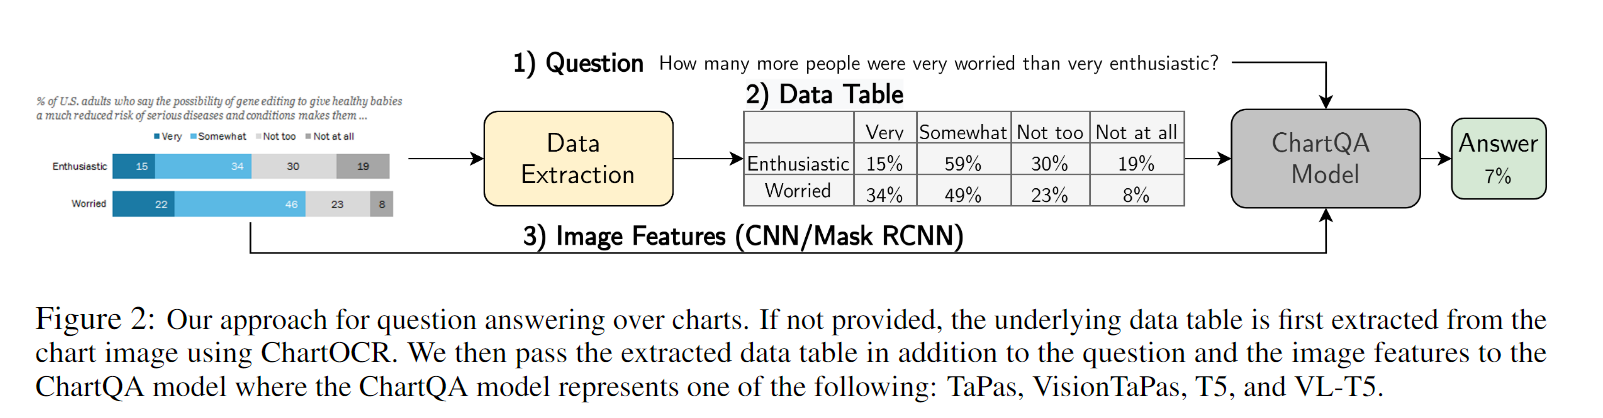
In this work, the research team proposed a large-scale benchmark, ChartQA, covering 9.6K human-written questions and 23.1K questions generated from human-written chart summaries. The Chart Question Answering system (ChartQA) predicts the answer by inputting a chart and a natural language question. Unlike text-based QA, the charts in ChartQA contain visual representations, and readers may pay more attention to some prominent features, such as trends, outliers, etc. The dataset contains real-world charts and manually written question-answer pairs. ChartQA differs from previous datasets in two ways: question type: human-authored vs. template-based chart source: real-world vs. generated using a tool
Data Collection
Data Collection & Preparation
Taken from four chart websites, covering different themes and various styles. All the websites containing underlying data tables were crawled.
Data Annotation
There are two main annotation methods: Use AMT (Amazon Mechanical Turk) to collect manually written QA pairs. Combinatorial questions (containing at least two operations) and visual questions were manually labeled. Generate QA pairs from human-written ones from Statista.
Build AI with AI
From idea to launch — accelerate your AI development with free AI co-coding, out-of-the-box environment and best price of GPUs.