Command Palette
Search for a command to run...
Le titre est vide. Veuillez fournir le titre à traduire.
Le titre est vide. Veuillez fournir le titre à traduire.
Analyse des séries temporelles — Du niveau débutant au niveau avancé
Résumé
Please provide the title and abstract you would like me to translate into French.
One-sentence Summary
This article proposes a discriminant analysis framework for replicated time series that models transfer functions as stochastic variables to account for within-group spectral variability, analyzes stochastic cepstra to derive parsimonious measures of relative power for optimal group separation, and validates the approach through a simulation study and an analysis of gait variability.
Key Contributions
- Proposes a statistical model for replicated time series that treats transfer functions as stochastic variables to account for both between-group and within-group spectral variability.
- Develops a discriminant analysis of stochastic cepstra that yields parsimonious relative power measures for optimal group separation and consistent classification using a finite number of estimated cepstral coefficients.
- Demonstrates the advantages of accounting for within-group spectral variability through a simulation study and an empirical analysis of gait variability data.
Introduction
Researchers routinely analyze replicated time series across distinct groups to extract distinguishing frequency domain patterns, a practice essential for applications like gait analysis and biomedical signal processing. Traditional discriminant methods, however, typically assume spectral characteristics remain uniform within each group, effectively ignoring the natural cyclical variations that occur among individual replicates. To bridge this gap, the authors leverage a modeling framework that treats transfer functions as stochastic variables, enabling the simultaneous capture of both between-group and within-group spectral differences. They then apply discriminant analysis to stochastic cepstra, yielding compact relative power metrics that reliably classify new observations while properly accounting for internal group variability. The approach remains computationally straightforward, as it relies on standard discriminant procedures applied to a finite set of estimated cepstral coefficients.
Dataset

-
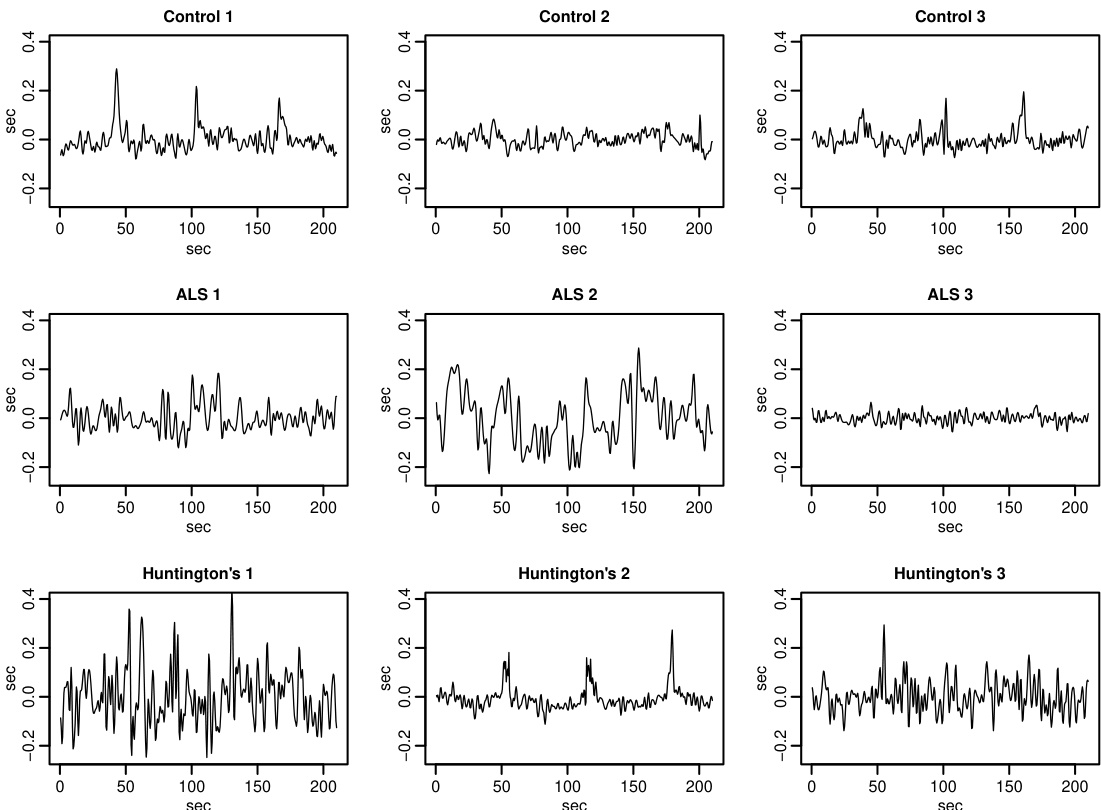
Dataset Composition and Sources The authors analyze gait variability data originally collected by Hausdorff et al. (2000) and publicly hosted on PhysioNet. The dataset records stride intervals from individuals across three neurological cohorts to support pathological characterization and diagnostic classification.
-
Subset Details
- Healthy controls: 16 participants
- Amyotrophic lateral sclerosis (ALS) patients: 11 participants
- Huntington’s disease patients: 18 participants
- Total cohort: 45 individuals
-
Cropping and Processing Pipeline
- Participants walked at a normal pace while wearing plantar pressure sensors.
- The analysis isolates left foot stride intervals, discarding a 20-second start-up period and retaining a fixed 3.5-minute window per subject.
- A 3 standard deviation median filter removes artifacts caused by hallway turns.
- The signal is interpolated using cubic smoothing splines, resampled to 2 Hz, and linearly detrended.
- This yields a standardized, detrended stride interval series of length 420 for each participant.
-
Model Usage and Analysis
- The processed series are transformed into log-spectral estimates using 7 multitapers, with cross-validation selecting 4 spectral coefficients.
- Two discriminant functions are constructed to contrast power across specific frequency bands, mapping each subject into a 2D feature space.
- Classification performance is evaluated using leave-one-out cross-validation rather than a fixed training-test split.
- The resulting discriminant scores drive the comparative assessment against alternative information-theoretic classifiers and serve as an interpretable diagnostic tool for separating the three neurological groups.
Method
The authors leverage a cepstral-based framework for discriminant analysis of time series data, designed to identify low-dimensional measures that best separate groups while accounting for within-group spectral variability. The core of the method revolves around transforming time series into a functional representation through log-spectra and their associated cepstral coefficients, enabling a rigorous and interpretable analysis of group differences. The replicate-specific log-spectrum is defined as γjk(λ)=log∣Ajk(λ)∣2, where Ajk(λ) represents the Fourier transform of the kth replicate from the jth group. The group mean log-spectrum is denoted by αj(λ)=E{γjk(λ)}, and the deviation from this mean is βjk(λ)=γjk(λ)−αj(λ). These log-spectra are then transformed into cepstral coefficients via cosine series, resulting in cjkℓ=∫01γjk(λ)2cos(2πλℓ)dλ for ℓ≥1, and cjk0=∫01γjk(λ)dλ, forming a sequence cjk∈RN. The group-average and deviation cepstra aj and bjk are similarly derived from αj and βjk, respectively.
The method proceeds by formulating a cepstral Fisher’s discriminant analysis, which seeks linear combinations of cepstral coefficients that maximize separation between group means relative to within-group variability. Let y0∈RN be a weight vector, and define the separation of the linear function ∑ℓ=0∞y0ℓcjkℓ as ∣∣y0∣∣Λ2=∑ℓ,m=0∞y0ℓΛ(ℓ,m)y0m, where Λ(ℓ,m) is the between-group kernel. The within-group kernel Γ(ℓ,m)=E(bjklbjkm) defines the covariance between linear combinations, with ∣∣y0∣∣Γ2=⟨y0,y0⟩Γ. The first discriminant is obtained by maximizing ∣∣y1∣∣Λ under the constraint ∣∣y1∣∣Γ=1, yielding djk1=∑ℓ=0∞y1ℓcjkℓ. Higher-order discriminants are defined sequentially, ensuring orthogonality to lower-order discriminants with respect to Γ, such that yq satisfies ⟨yq,ym⟩Γ=0 for m<q. The number of non-trivial discriminants Q is bounded by J−1, the number of groups, and the ranks of Λ and Γ. This framework produces parsimonious, interpretable measures that capture the most discriminative features across groups.
The approach can be extended to log-spectral weight functions. When ∑ℓ=0∞∣yqℓ∣<∞, the weight function ξq(λ)=yq0+∑ℓ=1∞yqℓ2cos(2πλℓ) exists, and the discriminant djkq can be expressed as ∫01ξq(λ)γjk(λ)dλ. This formulation connects the cepstral method to integral-based discriminant analysis, though the cepstral approach is more general, as it encompasses integral log-spectral discriminants when they exist.
Estimation is performed using a finite-dimensional approximation. Given n independent time series epochs of length N, the authors consider estimating cepstral coefficients via c^jkℓ=N−1∑m=0N−1γ^jkm2cos(2πλmℓ), where λm=m/N and γ^jkm is a log-spectral estimator. The multitaper method, which uses R orthonormal data tapers hrt, is advocated for its favorable bias, variance, and resolution properties. The rth tapered periodogram is Ijkrm=N−1/2∑t=1NhrtXjkte−2πiλmt2, and the multitaper log-spectral estimator is γ^jkm=log(R−1∑r=1RIjkrm).
For practical implementation, the authors truncate the cepstral coefficients to L dimensions, forming c^jkL=(c^jk0,…,c^jkL−1)T. Discriminants and weight functions are estimated using classical Fisher’s discriminant analysis on this finite-dimensional vector. The estimated group mean is a^jL=nj−1∑k=1njc^jkL, and the overall mean is a^L=∑j=1Jπ^ja^jL. The between-group kernel is estimated as Λ^L=∑j=1Jπ^j(a^jL−a^L)(a^jL−a^L)T. The within-group covariance is Γ^L=∑j=1Jπ^jΓ^Lj, where Γ^Lj=(nj−1)−1∑k=1njb^jkL(b^jkL)T and b^jkL=c^jkL−a^jL. The qth estimated weight function y^qL is the qth eigenvector of Γ^L−1Λ^L, and the discriminant is d^jkqL=(y^qL)Tc^jkL. The corresponding weight function ξ^qL(λ)=y^q0L+∑ℓ=1L−1y^qℓL2cos(2πλℓ) is interpretable even if the theoretical version ξq exists only in a limiting sense.
Classification of a new time series with unknown group membership proceeds by estimating its cepstrum c^∗L and computing its discriminants d^∗qL. The classification rule assigns the observation to the group j that minimizes ∑q=1Q(d^∗qL−μjq)2−2log(πj), where μjq=∑ℓ=0∞yqℓajℓ is the qth group-mean discriminant. This rule is optimal under Gaussianity and corresponds to the centroid classifier of Delaigle and Hall (2012). The number of cepstral coefficients L is selected via leave-one-out cross-validation, minimizing classification error across all replicates.
Theoretical consistency is established under regularity conditions. Assumptions on the smoothness of log-spectra ensure that the largest eigenvalue of the within-group covariance is bounded and the smallest eigenvalue σL decays slowly. Consistency of the estimated weight functions and discriminants requires σL−2n−1/2→0, σL−2N−1/2→0, and Ln−1/2→0 as n,N,L→∞. Under these conditions, y^qL converges in the Γ-norm to the true weight function yq, and d^jkqL converges in probability to djkq. Consequently, the classification rule Π^(c^∗L) converges in probability to the true group membership Π(c∗). The framework accommodates heterogeneity in within-group covariance by using a pooled estimate ∑j=1JπjΓj, and the estimator remains valid under this setting, though classification rates may require adjustment. The method provides a robust and interpretable approach to discriminant analysis in the presence of within-group spectral variability, offering advantages over traditional methods that assume identical replicates within groups.
Experiment
A simulation study evaluated time series classification procedures under varying levels of within-group spectral variability by testing conditional autoregressive processes across different training sample sizes and sequence lengths. The proposed cepstral Fisher's discriminant analysis consistently achieved higher out-of-sample classification accuracy than traditional methods that ignore group-level spectral differences, with multitaper-based estimation yielding the strongest performance. While the cepstral approach maintained robust accuracy regardless of spectral variability levels, conventional information criterion methods experienced significant performance degradation as within-group variability increased. These results validate the superior stability and effectiveness of the proposed framework for handling heterogeneous spectral patterns in time series classification.
The authors conducted a simulation study to evaluate classification procedures under varying levels of within-group spectral variability. Results show that cepstral Fisher's discriminant analysis consistently outperforms information criterion-based methods across all conditions, with performance differences influenced by the choice of log-spectral estimator. The classification rates of methods that do not account for within-group variability are more sensitive to increases in spectral variability. Cepstral Fisher's discriminant analysis achieves higher classification rates than information criterion-based methods across all experimental conditions. Among cepstral methods, the multitaper estimator performs best, while the direct estimator performs poorest. Methods ignoring within-group spectral variability show reduced classification performance as variability increases.
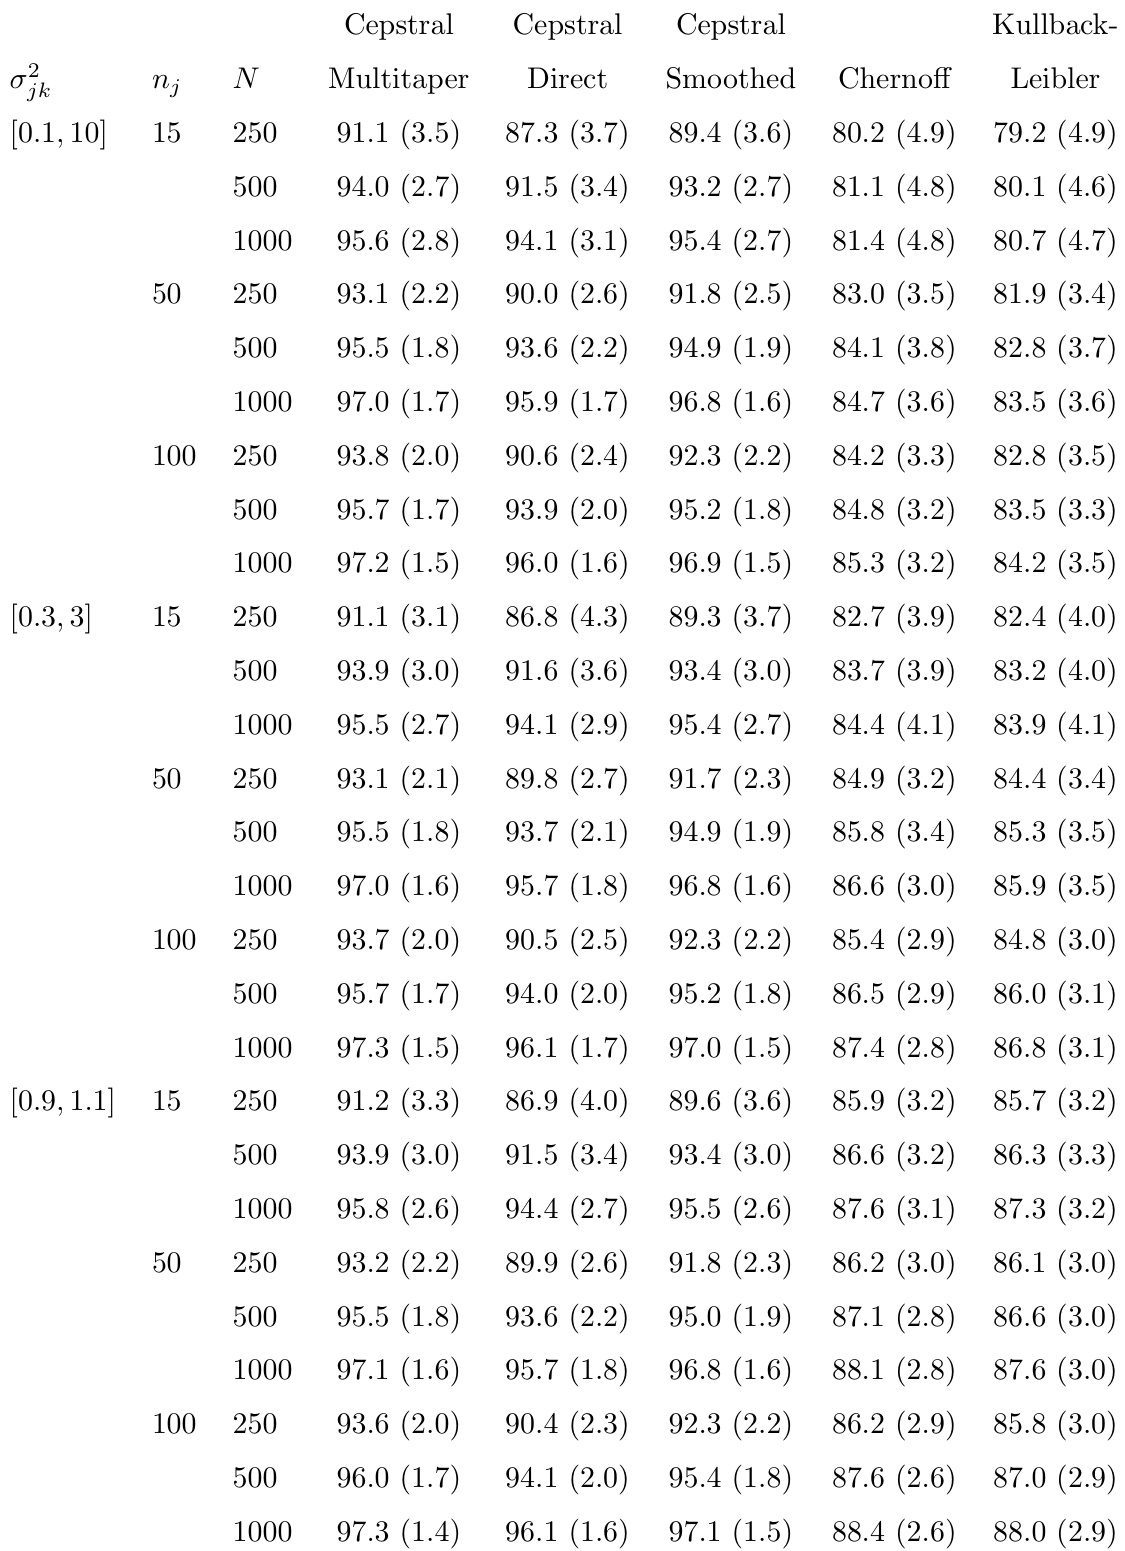
This simulation study evaluates classification procedures under varying levels of within-group spectral variability to validate their robustness against spectral fluctuations. The findings indicate that explicitly modeling within-group variability is critical, as approaches that ignore it suffer substantial performance degradation when variability increases. Cepstral Fisher's discriminant analysis consistently outperforms information criterion-based methods across all conditions, with overall accuracy heavily influenced by the selection of the log-spectral estimator. Among the tested estimators, the multitaper approach delivers the most reliable results, whereas the direct method proves least effective.