Command Palette
Search for a command to run...
ChartNet: A Million-Scale, High-Quality Multimodal Dataset for Robust Chart Understanding
ChartNet: A Million-Scale, High-Quality Multimodal Dataset for Robust Chart Understanding
Abstract
Understanding charts requires models to jointly reason over geometric visual patterns, structured numerical data, and natural language — a capability where current vision-language models (VLMs) remain limited. We introduce ChartNet, a high-quality, million-scale multimodal dataset designed to advance chart interpretation and reasoning. ChartNet leverages a novel code-guided synthesis pipeline to generate 1.5 million diverse chart samples spanning 24 chart types and 6 plotting libraries. Each sample consists of five aligned components: plotting code, rendered chart image, data table, natural language summary, and question-answering with reasoning, providing fine-grained cross-modal alignment. To capture the full spectrum of chart comprehension, ChartNet additionally includes specialized subsets encompassing human annotated data, real-world data, safety, and grounding. Moreover, a rigorous quality-filtering pipeline ensures visual fidelity, semantic accuracy, and diversity across chart representations. Fine-tuning on ChartNet consistently improves results across benchmarks, demonstrating its utility as large-scale supervision for multimodal models. As the largest open-source dataset of its kind, ChartNet aims to support the development of foundation models with robust and generalizable capabilities for data visualization understanding.
One-sentence Summary
ChartNet is a million-scale, high-quality multimodal dataset designed to advance chart interpretation through a novel code-guided synthesis pipeline generating 1.5 million diverse samples across 24 chart types and 6 plotting libraries with five aligned components including plotting code, rendered chart images, data tables, natural language summaries, and question-answering with reasoning, while rigorous quality filtering ensures visual fidelity and semantic accuracy to consistently improve vision-language model performance across benchmarks upon fine-tuning.
Key Contributions
- This work introduces ChartNet, a high-quality, million-scale multimodal dataset designed to advance chart interpretation and reasoning through a novel code-guided synthesis pipeline. The dataset generates 1.5 million diverse chart samples spanning 24 chart types and 6 plotting libraries.
- Each sample consists of five aligned components providing fine-grained cross-modal alignment, while specialized subsets cover human annotated data and safety. A rigorous quality-filtering pipeline ensures visual fidelity and semantic accuracy across these diverse chart representations.
- Fine-tuning on ChartNet consistently improves results across benchmarks, demonstrating its utility as large-scale supervision for multimodal models. Experiments show consistent gains across model sizes and architectures, often surpassing much larger open-source systems and even proprietary frontier models such as GPT-4o.
Introduction
Visual language models require high-fidelity supervision to accurately interpret data visualizations, yet current synthetic datasets often suffer from limited diversity in chart types and modalities. Existing approaches typically rely on image-space generation or fail to fully align visual outputs with underlying structured data and reasoning traces. To address this bottleneck, the authors propose ChartNet, a million-scale multimodal dataset generated via a code-guided pipeline that ensures visual fidelity and semantic correctness. By releasing over 1.5 million aligned tuples including images, plotting code, and CSV data, they enable vision-language models to transition from merely describing charts to understanding the structured information they encode.
Dataset
ChartNet Dataset Description
- Dataset Composition: The authors introduce ChartNet, a high-quality multimodal dataset comprising 1.5 million synthetic samples. Each instance aligns five components: chart images, plotting code, data tables, natural language summaries, and reasoning-based question-answer pairs.
- Key Subsets:
- Core Synthetic Data: Derived from 150,000 seed images from TinyChart, expanded via code-guided augmentation to cover 24 chart types and 6 plotting libraries.
- Human-Annotated Data: Contains 96,643 synthetic charts verified by domain experts to ensure semantic accuracy and high-quality annotations.
- Real-World Charts: Includes 30,000 charts from sources like the World Bank and Pew Research Center, filtered for interpretability and copyright compliance.
- Grounding Data: Provides geometry-aware annotations with bounding boxes extracted from plotting code and filtered via an entropy-based approach.
- Safety Data: Consists of 7,000 training samples and 600 test samples featuring adversarial prompts on sensitive topics to improve model robustness.
- Processing Pipeline:
- Synthesis: A Vision-Language Model reconstructs code from images, which is then iteratively rewritten by an LLM to generate diverse variations.
- Quality Control: Executed scripts are paired with rendered images, while a VLM filters out samples with visual defects such as overlapping text or cropped labels.
- Metadata Construction: Tabular data and grounded descriptions are generated using code context, while Chain-of-Thought reasoning traces are produced using the Vision-R1 framework.
- Usage in Model Training:
- The dataset is used for fine-tuning multimodal models to enhance chart interpretation and reasoning capabilities.
- Fine-tuning on ChartNet demonstrates consistent improvements across benchmarks, enabling models to outperform larger proprietary systems.
Method
The core methodological insight of this approach is that executable plotting code serves as a structured intermediate representation for data visualizations. The authors introduce an automated pipeline for code-guided synthetic chart generation that operates in two primary phases: chart reconstruction and iterative augmentation.
As shown in the framework diagram below, the process begins with a limited dataset of seed chart images. A Vision Language Model (VLM) analyzes the seed chart along with a specific prompt to generate Python code that approximately reconstructs the original visualization. This code includes data definitions and plotting instructions using libraries such as pandas and plotly.
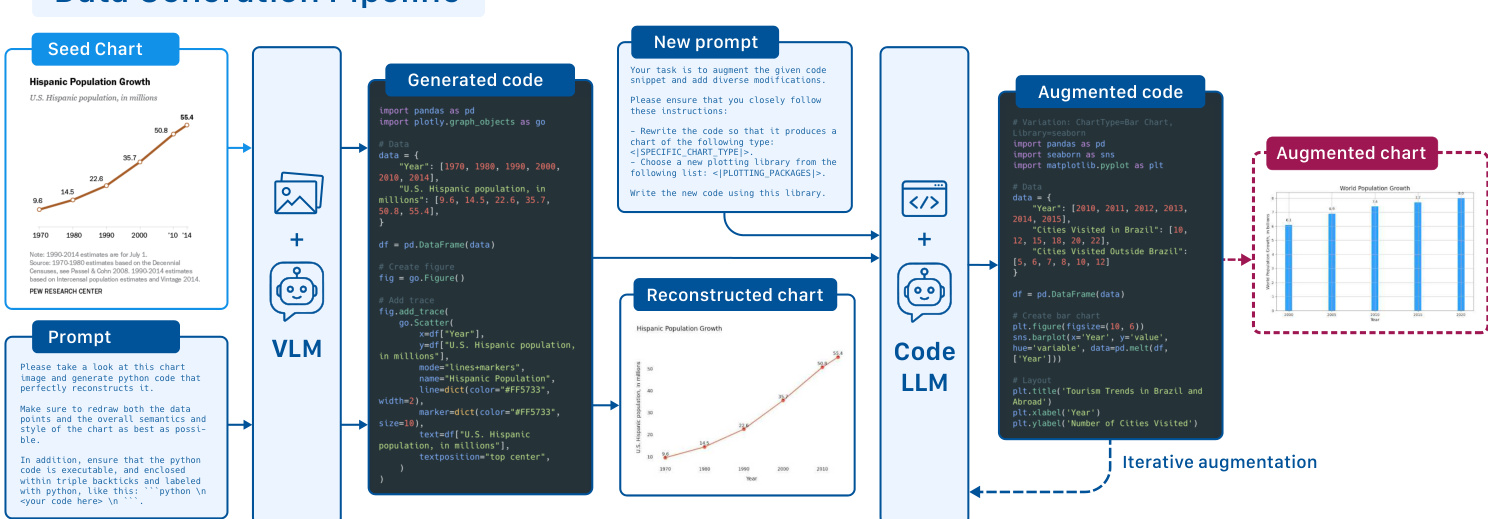
Once the initial code is generated and verified, the pipeline leverages a Code Large Language Model to perform iterative augmentation. By providing new prompts that specify diverse modifications, such as changing the chart type or data distribution, the model produces augmented code. This code is then executed to generate new, visually distinct charts. The authors utilize pixtral-large-instruct-2411 for the chart-to-code reconstruction and quality filtering stages, while gpt-oss-120b is employed for the code-guided chart augmentation stage. This setup allows for the generation of over one million annotated data points with high throughput.
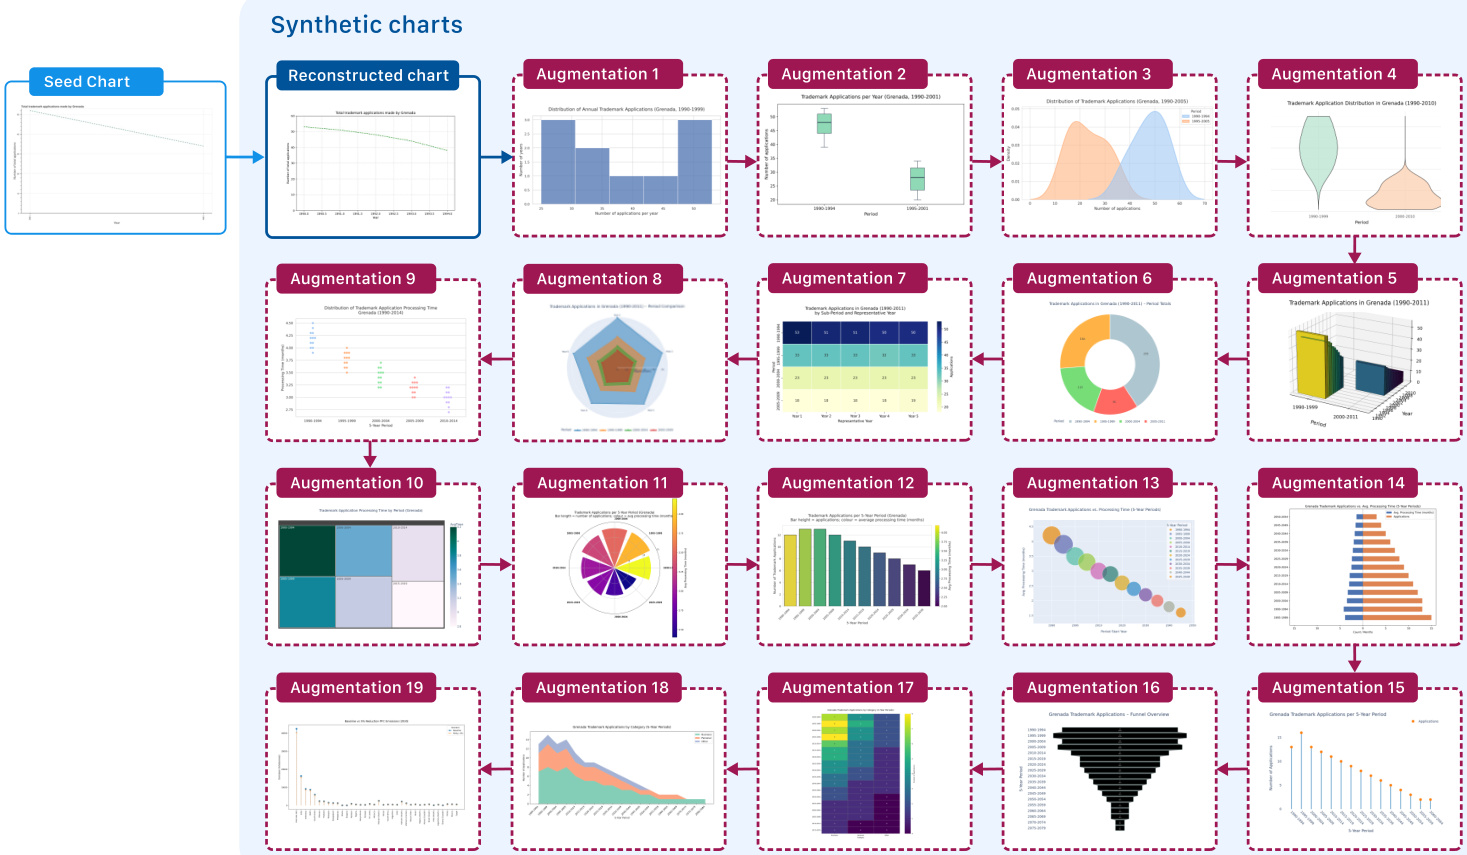
The output of this iterative process is a diverse collection of synthetic charts derived from a single seed. As illustrated in the synthetic charts visualization below, the pipeline successfully generates a wide variety of chart types, including bar charts, box plots, heatmaps, radar charts, and treemaps. This diversity ensures that the resulting dataset covers a broad spectrum of visual encodings and data distributions.
In addition to visual generation, the framework includes a multi-stage prompting pipeline to generate long-form chain-of-thought reasoning traces. This process involves eliciting complex questions, creating structured plans and captions, and deriving explicit reasoning steps. A modality-bridging step is applied to make the reasoning usable by language-only models, followed by the generation of a detailed CoT trace using GPT-OSS. This comprehensive approach aligns visual content with logical reasoning, providing rich supervision for training and evaluation.
Experiment
The study trained visual language models of varying scales on the ChartNet dataset to assess improvements across chart reconstruction, data extraction, summarization, and reasoning tasks. Finetuning yielded consistent performance gains that enabled smaller models to surpass larger off-the-shelf counterparts and GPT-4o, highlighting the value of high-quality multimodal supervision over mere model scaling. Additionally, the study validated the reliability of automated evaluation by demonstrating strong alignment between GPT-4o judgments and human annotations on complex data extraction tasks.
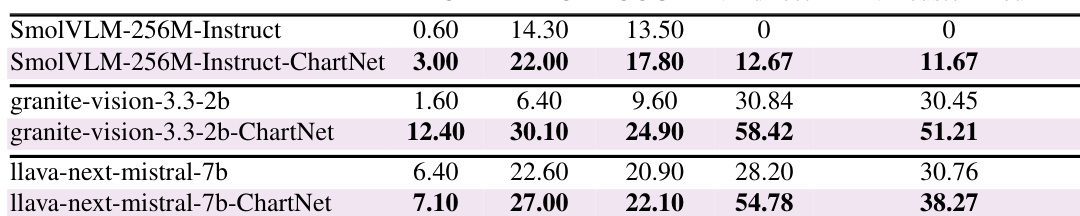
The authors evaluate the generalizability of ChartNet training on real-world public benchmarks for chart summarization and code generation. The results demonstrate that finetuning on ChartNet consistently leads to substantial performance gains across all model sizes compared to their base versions. Finetuning on ChartNet results in consistent performance improvements across all tested model scales, from ultra-compact to medium-sized models. The Granite-Vision model shows marked improvements in both summarization and code generation tasks after finetuning. Even the smallest model variant gains non-trivial capability on real-world benchmarks after training on the ChartNet dataset.
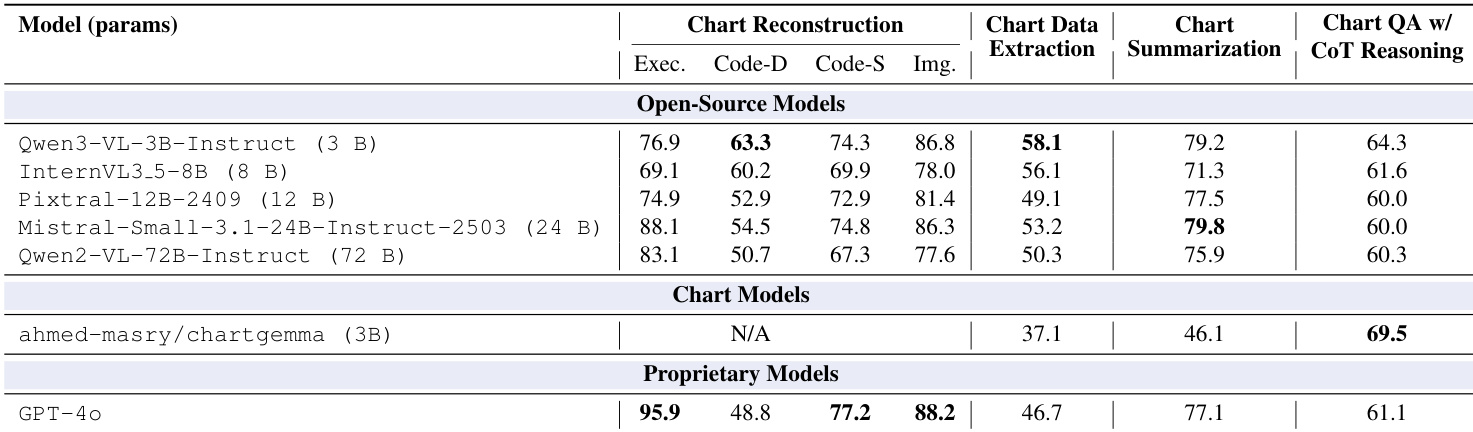
The the the table compares the baseline performance of open-source, specialized, and proprietary models on chart understanding tasks including reconstruction, data extraction, summarization, and QA. Proprietary models demonstrate strong capabilities in code execution and visual reconstruction, while smaller open-source models show competitive data fidelity. Specialized chart models exhibit superior performance in complex reasoning tasks compared to general-purpose large language models. Proprietary models achieve the highest execution rates and visual similarity in chart reconstruction. Open-source models demonstrate superior data fidelity in code generation and data extraction compared to proprietary baselines. Specialized chart models lead in complex reasoning tasks such as chart QA with CoT.
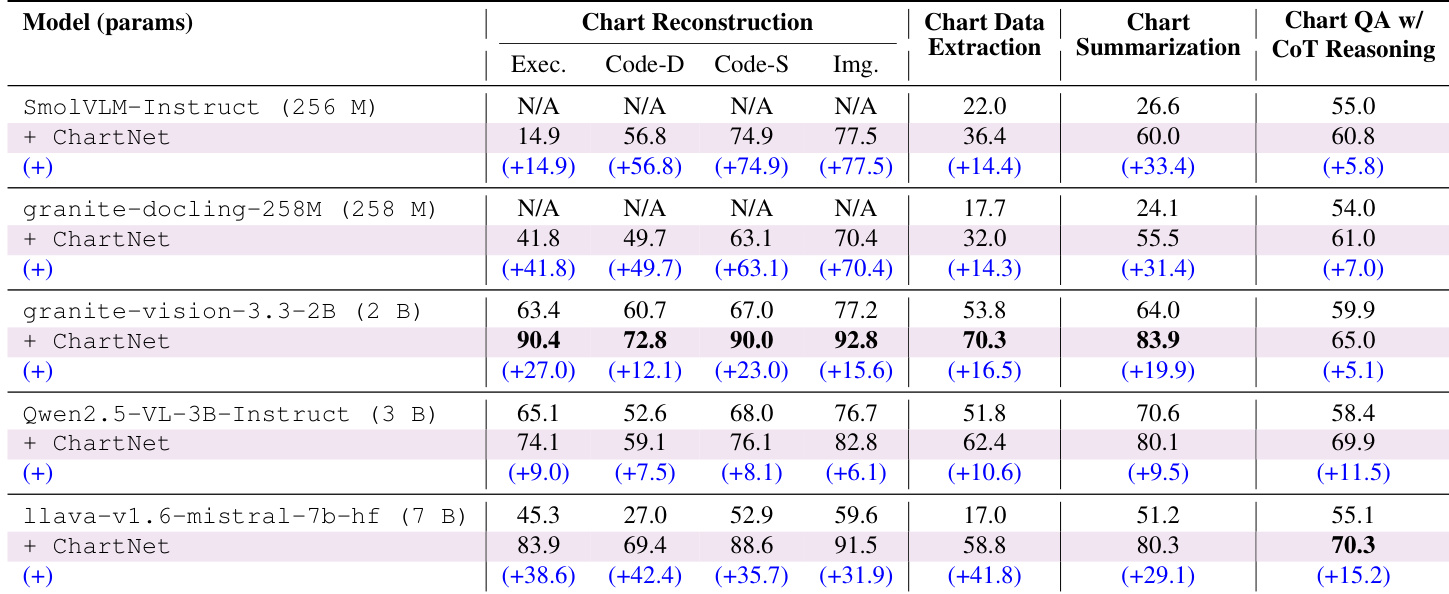
The authors evaluate various vision language models to demonstrate the effectiveness of the ChartNet dataset in enhancing chart understanding capabilities. Results show that supervised finetuning produces substantial and consistent performance gains across all chart understanding tasks, regardless of model scale. Even ultra-compact models that initially lacked reconstruction capabilities gain functional skills, while larger models achieve significantly higher accuracy in data extraction and summarization. Finetuning on ChartNet consistently improves model performance across chart reconstruction, data extraction, summarization, and reasoning tasks. Ultra-compact models gain functional chart reconstruction capabilities after training, while larger models reach high accuracy levels in visual alignment and code generation. The magnitude of improvement is scale-invariant, indicating that high-quality multimodal supervision is more critical than model size for chart interpretation.
The authors evaluate ChartNet training generalizability on real-world benchmarks while comparing baseline performances across proprietary, open-source, and specialized models. Supervised finetuning on the dataset yields consistent performance improvements across all model scales, enabling even ultra-compact variants to acquire functional chart reconstruction capabilities. While proprietary models excel in visual reconstruction and specialized models outperform general-purpose models in complex reasoning, the findings ultimately suggest that high-quality multimodal supervision is more critical than model size for chart interpretation.